15 Oct 2026
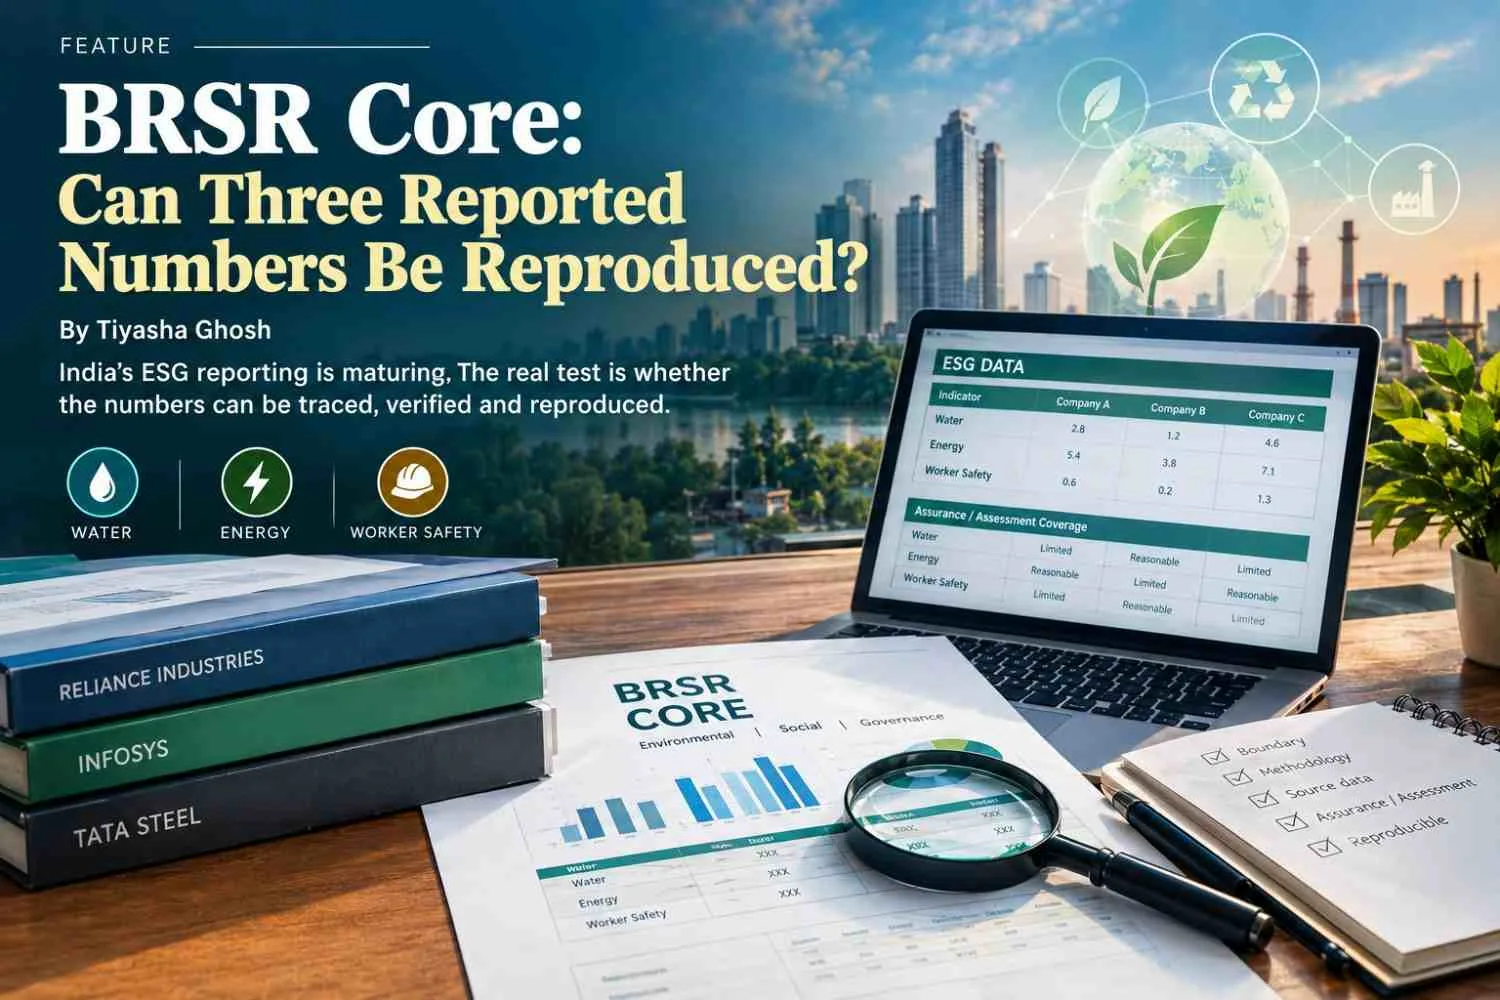
15 October 2026 | Kolkata India’s BRSR Core has moved ESG reporting closer to evidence. But a reported number is only as credible as its boundary, source data, methodology and verification trail. Summary: India’s BRSR Core framework is moving corporate sustainability reporting from broad disclosure towards measurable, verifiable evidence. But as FY2025 - 26 becomes a critical reporting year, the real test is whether reported figures for water, energy and worker safety can actually be reproduced from the underlying data, stated boundaries and methodologies. A comparison of Reliance, Infosys and Tata Steel shows why apparently similar ESG numbers can represent very different operational boundaries, denominators and assurance coverage. The investigation therefore asks not simply whether a number has been “assured”, but whether another reviewer can trace it back to its source, understand how it was calculated and determine exactly what the assurance or assessment covered. The same test becomes even more important as companies gradually use automated and AI-enabled software for carbon accounting and ESG data management. Can BRSR Core Numbers Be Independently Reproduced-or Are Companies Still Reporting Figures That Cannot Be Compared at Face Value? India’s sustainability reporting framework is becoming more structured. But differences in reporting boundaries, calculation methods and assurance coverage raise a crucial question: how much can an outside reader actually verify? When a company says it has reduced its environmental impact, what should readers look for beyond the headline figure? Can they trace the number to its source, understand how it was calculated and establish exactly which operations it covers? These questions matter as Indian companies publish increasingly detailed Business Responsibility and Sustainability Reports (BRSRs). The Securities and Exchange Board of India (SEBI) introduced BRSR Core to standardise selected environmental, social and governance indicators. Later regulatory changes also provided for third-party assessment or assurance, while making value-chain ESG disclosures voluntary from FY2025–26 under the revised framework. But a standard reporting format does not automatically make every figure comparable—or independently reproducible. A review of the FY2025–26 reports of Reliance Industries, Infosys and Tata Steel shows why the distinction matters. Their published disclosures contain figures that can be checked against other information in the same reports. They also demonstrate how reporting boundaries and assurance scopes affect what those figures can establish. What This Review Checked The review examined the companies’ published BRSRs, annual reports and available assurance statements. It checked whether selected totals could be reconciled with their published components and compared the stated reporting boundaries with the indicators covered by third-party assurance. It did not access internal meter readings, utility bills, fuel invoices, employee time records, incident registers or complete calculation workbooks. It therefore does not claim to have independently verified the underlying source data or completed an external audit of the companies. That limitation is important. Reproducing a calculation from published figures is not the same as independently verifying the records from which those figures originated. 1. The Same Company Can Report Different Boundaries for Different IndicatorsTABLE 1. What the FY2025–26 reports disclose CompanyIndicatorReported figureReporting detail that mattersReliance IndustriesEnergy consumption517 million GJ; 5.4 million GJ from renewable sourcesReported for O2C and E&P operations; assurance scope is defined by indicator and entity.Reliance IndustriesWater228.52 million kL withdrawn; 112.07 million kL recycledThe report identifies the relevant hydrocarbon reporting boundary.InfosysEnergy consumption887,193 GJGlobal consumption; renewable and non-renewable subtotals are published.InfosysWater2,125,432 kL withdrawn; 2,029,557 kL consumedGlobal water figures; reporting is consolidated unless otherwise specified.InfosysEmployee LTIFR0.134 per million person-hoursApplies to India operations; a separate worker category is not reported.Tata SteelWater consumption126.350 million kL, consolidatedThe report also provides source-wise water withdrawal and water intensity per tonne of crude steel.Tata SteelLTIFREmployees: 0.64; workers: 0.38, consolidatedThe assurance statement specifies standalone assurance for BRSR Core indicators, while selected consolidated indicators are disclosed voluntarily. Figures are taken from the companies’ FY2025–26 reports. Differences in reporting boundaries, definitions and assurance scope mean these figures should not be used to rank company performance directly. Source: Company annual reports and BRSR disclosures; links are provided in the article’s source list. Reliance Industries reports total energy consumption of 517 million gigajoules (GJ) for its Oil-to-Chemicals (O2C) and Exploration and Production (E&P) operations, including 5.4 million GJ from renewable sources. Its natural-capital disclosures also report 228.52 million kilolitres (kL) of water withdrawal, 38.85 million kL discharged and 112.07 million kL recycled during FY2025–26. However, the assurance statement does not treat every indicator as having one identical boundary. Its listed scope covers energy consumption for O2C entities and specified digital subsidiaries; water withdrawal, discharge, consumption and recycling for O2C entities; and workplace injury indicators for O2C entities and specified digital subsidiaries. The report also defines the entities covered by these terms. This does not establish that the reported figures are incorrect. It shows why readers need to examine the boundary attached to each indicator rather than assume that every figure represents the entire Reliance group on the same basis. Infosys, meanwhile, states that its BRSR disclosures are consolidated unless otherwise specified. Its reported energy and water figures include global consumption, while its employee lost-time injury frequency rate (LTIFR) is specifically reported for India operations. Its reasonable-assurance statement also makes clear that the opinion covers the listed BRSR Core indicators within the defined reporting boundary-not every item in the annual report. Tata Steel presents another important distinction. It publishes selected consolidated indicators, but its FY2025–26 statement says reasonable assurance of the BRSR Core indicators was undertaken on a standalone basis. Consolidated indicators were voluntarily disclosed for selected entities, with a pathway towards consolidated assurance following restructuring. The central finding is that a reported figure must be read alongside its boundary and assurance scope. A consolidated number and a standalone number cannot automatically be treated as equivalent. 2. Published Totals Can Be Checked—but That Is Only the First TestTABLE 2. What can be reproduced from published subtotals? CheckPublished calculationResultStatusInfosys — energy640,111 GJ renewable + 247,082 GJ non-renewable887,193 GJReconciles with reported totalInfosys — water withdrawal281,568 kL surface water + 65,518 kL groundwater + 1,778,346 kL third-party water2,125,432 kLReconciles with reported totalTata Steel — consolidated water withdrawal126,370 + 21,521 + 22,607 + 161,080 + 15,538 million litres347,116 million litresReconciles with reported totalReliance Industries — water and energyHeadline figures and selected components are disclosedFull source-level reconstruction not performed in this reviewUnderlying records not independently reproduced How to read this table: “Reconciles” means the published components add up to the reported total. It does not mean that this review independently checked the original meter readings, invoices, source records or company consolidation process. Some figures can be reconciled using the components disclosed in the same report. Infosys reports total energy consumption of 887,193 GJ. Its renewable energy consumption totals 640,111 GJ, while non-renewable energy consumption totals 247,082 GJ. Adding these two figures reproduces the reported total. Its water-withdrawal table also provides a check. Surface water of 281,568 kL, groundwater of 65,518 kL and third-party water of 1,778,346 kL add up to the reported total withdrawal of 2,125,432 kL. Tata Steel’s consolidated water-withdrawal components also add up to its reported total of 347,116 million litres. These are meaningful arithmetic checks because the inputs and the stated totals are publicly available. However, the checks establish only that the published components add up. They do not independently establish whether every source measurement was accurate, whether all relevant facilities were included or whether the original records were correctly classified. CompanyPublished figure checkedResult of the public-data checkWhat remains unverified by this reviewInfosysTotal energy consumption: 887,193 GJRenewable and non-renewable subtotals add up to the reported total.Underlying meter, fuel and source records were not independently examined.InfosysTotal water withdrawal: 2,125,432 kLPublished source-wise figures add up to the reported total.Original source records and site-level measurements were not independently examined.Tata SteelConsolidated water withdrawal: 347,116 million litresPublished source-wise figures add up to the reported total.Source records, site-level measurements and consolidation files were not independently examined.Reliance IndustriesEnergy and water indicatorsThe report provides headline figures and identifies indicator-specific boundaries.This review did not reconstruct the totals from original operational records. These results support a limited but useful conclusion: some published calculations can be checked from the report itself, while the underlying source data cannot be independently reproduced from the information examined here. 3. Water Figures Need More Than a Single NumberFIGURE 1. From an ESG number to verifiable evidence Reported figure↓Definition and reporting boundary — What is counted, and which sites, businesses or workers are included?↓Source records — Meter readings, utility bills, fuel records, production data, hours worked or incident registers↓Calculation method — Formula, conversion factor, assumptions, exclusions and denominator↓Consolidation — How individual sites, units and subsidiaries are combined↓Assurance or assessment — Which indicator and reporting boundary were examined, and at what level?↓Reproducibility result — Can the figure be reconstructed from the available evidence? A figure is easier to verify when the reporting boundary, source data, calculation method and assurance scope can all be traced. A published total alone does not provide the complete evidence trail. Water reporting illustrates why comparisons can be misleading when definitions differ. Water withdrawal refers to the water taken from sources such as rivers, groundwater, municipal supplies or the sea. Water consumption refers to the portion not returned to the environment during the reporting period, as defined by the applicable reporting method. Water discharged and water recycled or reused are separate measures. Reliance reports water withdrawal and recycled water, while Infosys separately reports withdrawal and consumption. Tata Steel reports both measures, along with source-wise withdrawal and water intensity per tonne of crude steel. These indicators answer different questions. A company may withdraw a large volume of water but return much of it after use. Another may withdraw less water but consume a larger proportion. Comparing the figures without checking the definitions would create a false ranking. A stronger reproducibility test would trace water withdrawal from the source-wise totals to the relevant utility bills, meter readings or estimates, then examine how recycled water, discharge and consumption were calculated. It would also check whether the same facilities and reporting period were used throughout the calculation. The public reports allow some arithmetic checks. They do not, by themselves, provide this review with the complete underlying records needed to reconstruct each company’s water balance independently. 4. Energy and Workplace Safety Also Depend on Definitions Energy consumption is meaningful, but the total alone does not establish efficiency. A large industrial producer and a technology-services company have very different operating models. Their energy use must be interpreted alongside suitable denominators, such as production output, floor area, revenue or another relevant activity measure. Even intensity figures require care. The denominator, reporting boundary and treatment of renewable energy must be consistent before a comparison can be considered meaningful. Workplace safety presents a similar problem. Reliance reports LTIFR figures for different business units, while Infosys reports an employee LTIFR for India operations and states that it has not reported a separate worker category. Tata Steel reports separate employee and worker rates for both standalone and consolidated operations. For FY2025–26, Tata Steel reports a consolidated LTIFR of 0.64 for employees and 0.38 for workers, compared with standalone figures of 0.49 and 0.36 respectively. The company defines workers in this table to include third-party contractors. These figures cannot be ranked fairly without checking who is included, the hours worked, the reporting period and the definition of a recordable injury. A lower rate is not, on its own, proof that one company provides a safer workplace than another. 5. Assurance Is Important—but Its Scope Matters Third-party assurance provides an important layer of scrutiny. Infosys’s assurance statement describes procedures including document inspection, evaluation of quantification methods, reconciliation with underlying records on a sample basis, and testing of selected assumptions and methodologies. Reliance’s statement similarly describes different assurance levels and lists the indicators and boundaries covered. Tata Steel states that its BRSR Core indicators received reasonable assurance on a standalone basis, while selected consolidated indicators were disclosed voluntarily. The lesson is not that assurance is ineffective. It is that readers must understand what was assured, which operations were covered and which disclosures were outside the engagement. Reasonable assurance is a conclusion on specified information within a defined scope. It is not a blanket guarantee that every statement in a sustainability report has been verified, nor does it mean an outside reader can reproduce the underlying calculation using only public information. The Next Challenge: Reconstructing AI-Assisted Carbon Figures The same question becomes more complicated when companies use models, software or AI-assisted systems to estimate value-chain emissions. The GHG Protocol’s Scope 3 guidance recognises multiple calculation methods and different forms of data, including supplier-specific information, industry averages and proxy data. These approaches can be appropriate in different circumstances, but the method and data quality affect the result. A credible reproducibility trail should identify the activity data, emission factors and their sources, the reporting boundary, assumptions, exclusions and the calculation method. For AI-assisted estimates, it should also preserve relevant model or software versions and material human adjustments. This is a logical next stage of the investigation, rather than a conclusion that the three companies examined here used unreliable AI-generated figures. The reports reviewed do not establish that claim. From Disclosure to Demonstrable Evidence TABLE 3. Public-evidence reproducibility ledger CompanyIndicatorPublic-document checkEvidence statusInfosysEnergy consumptionPublished renewable and non-renewable components add up to the reported total.Arithmetic reconciled; source records not independently reproducedInfosysWater withdrawalPublished source-wise figures add up to the reported total.Arithmetic reconciled; source records not independently reproducedTata SteelWater withdrawalPublished source-wise figures add up to the consolidated total.Arithmetic reconciled; source records not independently reproducedReliance IndustriesEnergy consumptionPublished total and renewable component identified; original operational records were not examined.Reported figure identified; source-level reconstruction not performedReliance IndustriesWaterPublished withdrawal, discharge and recycling figures identified; a complete water balance was not reconstructed.Reported figures identified; source-level reconstruction not performedAll three companiesWorkplace safetyReporting boundaries, worker categories and assurance scope differ.Not directly comparable without further boundary and method checks Status definitions Arithmetic reconciled: Published subtotals add up to the published total.Reported figure identified: The figure appears in an official report, but this review did not reconstruct it from underlying records.Not independently reproduced: The source records needed for independent reconstruction were not examined in this review.Not directly comparable: Definitions, reporting boundaries or calculation methods differ in ways that prevent a like-for-like comparison. The FY2025–26 documents of Reliance Industries, Infosys and Tata Steel show that structured ESG reporting can provide useful figures, definitions and assurance statements. They also show why totals should not be compared without examining the boundaries and methods behind them. This public-document review reproduced selected arithmetic relationships from the published tables. It did not independently verify the underlying operational records, and it found that reporting and assurance boundaries differ across indicators and companies. The next step towards a fuller reproducibility audit would be to request source-wise calculations and supporting records, examine the relevant assurance criteria, and document whether the reported figures can be reconstructed from evidence beyond the headline disclosures. The test for transparent sustainability reporting is therefore not simply whether a number appears in a report. It is whether a reader can understand what the number represents, trace how it was calculated, and see exactly what the available evidence does—and does not—establish. Sources: SEBI — BRSR Core framework, 12 July 2023SEBI — FAQs on assessment, assurance and value-chain disclosuresReliance Industries — FY2025–26 Natural Capital disclosuresReliance Industries — Independent Assurance Report, FY2025–26Infosys — Integrated Annual Report, FY2025–26Tata Steel — BRSR, FY2025–26Tata Steel — Integrated Report and Annual Accounts, FY2025–26GHG Protocol — Scope 3 Calculation Guidance Scope note: This article is based on publicly available documents. It does not claim that company source records were independently audited or that company representatives were interviewed. ...Read more