Total Articles 231+

Sector Reviews

In-depth analysis of industries to assess sustainability performance, challenges, and opportunities for greener transformation.

Showing 12/16

09 Oct 2026

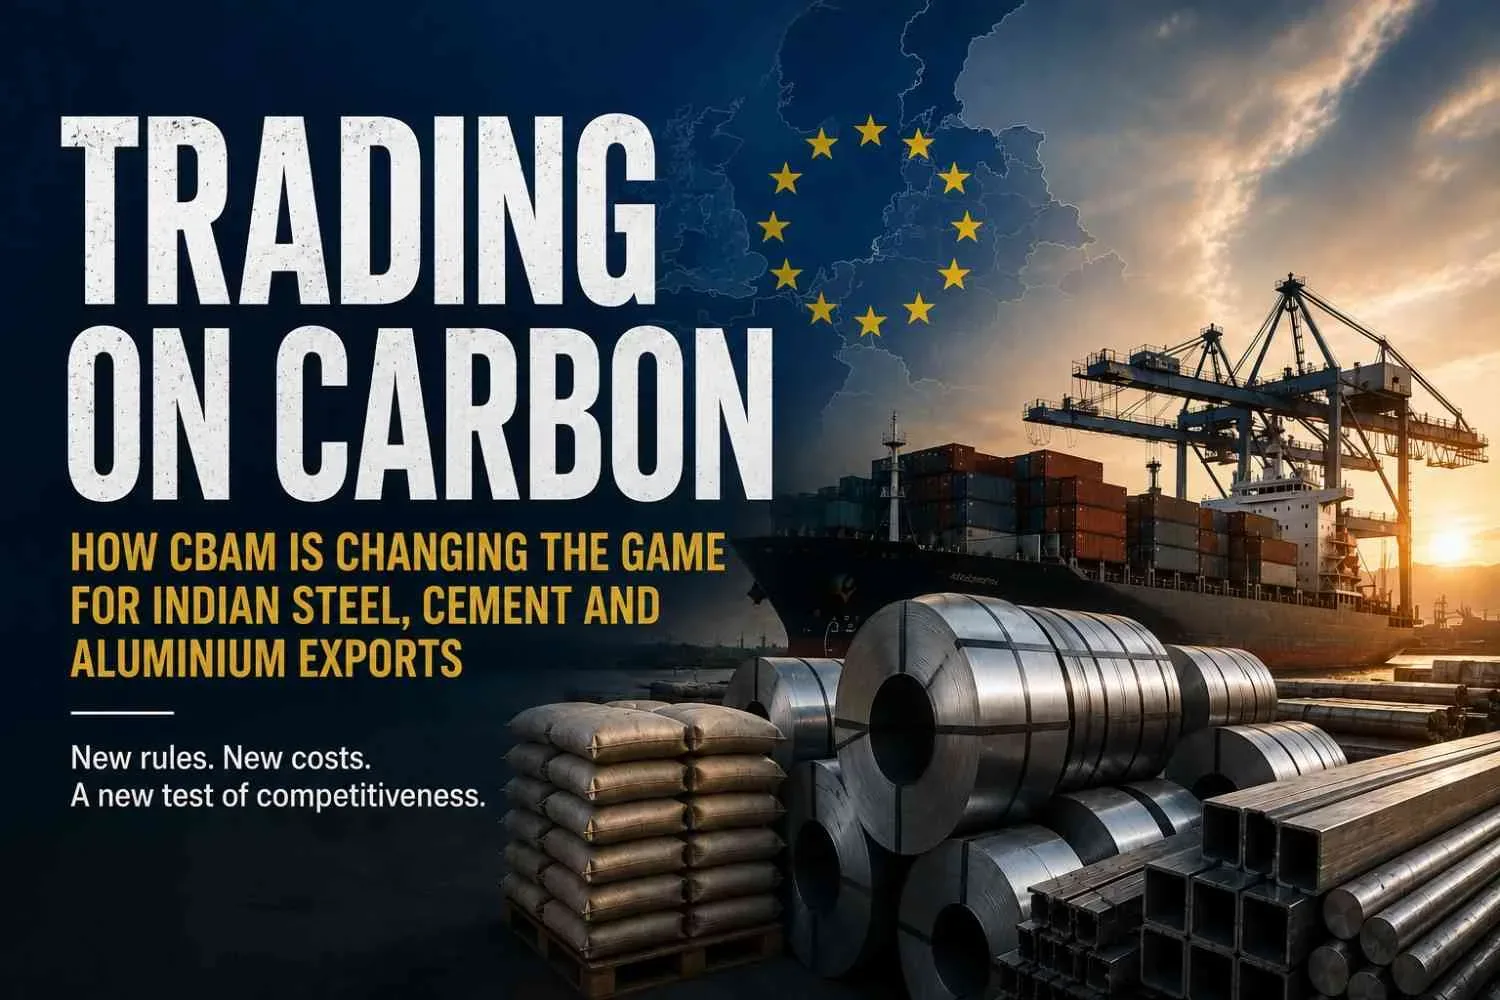
9 October, 2026 | Kolkata Cotton is natural, familiar and widely used - but that does not automatically make every cotton shirt environmentally responsible. World Cotton Day highlights the need to look beyond sustainability labels and examine the water use, chemical management, farmer earnings, fabric quality and supply-chain transparency behind cotton clothing, especially when making festive purchases. SummaryIndia’s cotton industry supports farmers, textile workers and export businesses. But a shirt’s sustainability depends on more than its fibre label. Water availability, pesticide use, textile processing, durability, organic certification and the income farmers retain all matter. Following World Cotton Day on 7 October, the question is whether brands can prove their sustainability claims from the farm to the finished garment. If cotton is natural, what makes a cotton shirt sustainable? World Cotton Day, observed every year on 7 October, recognises cotton’s role in livelihoods, trade and the global textile industry. The 2026 observance highlighted the theme “Cotton for Good: Building Prosperity Through Trade, Transformation and Partnership”, placing economic opportunity and sustainability within the same conversation.  But the conversation should not end with celebrating cotton as a natural fibre. It should also ask how it is grown, how much water and how many chemicals are involved, whether farmers earn enough, and what happens when the fibre reaches textile factories. These questions matter when consumers begin buying clothes for Durga Puja, Deepawali and other festive occasions. A label may describe a shirt as cotton, organic or sustainably sourced, but each term tells us something different. None of them automatically proves that the entire garment has a low environmental footprint. The Food and Agriculture Organization (FAO) identifies cotton as an important source of income and employment for millions of smallholders and people across the textile value chain. Cotton also competes with fibres such as polyester, while manufacturers face pressure to control costs and meet buyers’ quality requirements. Sustainability therefore involves environmental protection, economic viability and the livelihoods of people who grow and process the crop.  The Hidden Water Cost of Your Cotton ShirtCotton is often criticised for its high water requirements, but its impact varies depending on where and how it is grown. Rain-fed cotton, irrigated cotton and cotton cultivated under different soil and weather conditions cannot be treated as though they have the same water footprint. A 2025 study of cotton production in central India examined water use, runoff and soil loss under rain-fed and drip-irrigated conditions between 2019 and 2022. The researchers reported that 51% of the average annual rainfall during the study period was lost through runoff. They estimated crop water use at 541 millimetres under rain-fed conditions and 624 millimetres under drip irrigation. The study also found that drip irrigation improved lint yield and reduced the calculated water footprint compared with the rain-fed system examined. These findings highlight why local conditions and the methods used to measure water consumption matter. However, they should not be treated as representative measurements for every cotton farm in Vidarbha. For this investigation, the reporting must trace the cotton back to where it was grown and establish whether the farm relied on rainfall, groundwater, canal water or another source. Farm records, irrigation details, local rainfall data and water-stress assessments can help provide this context. If a brand claims that its cotton uses less water, it should clearly explain the method, assessment boundary and comparison behind that claim. The investigation must also follow the material beyond the farm. Ginning separates cotton fibres from seeds, spinning turns the fibres into yarn, and weaving or knitting converts the yarn into fabric. Dyeing, washing and finishing can require additional water and chemicals. Therefore, lower water use during cultivation does not automatically mean that the finished shirt has a lower overall environmental footprint. Organic cotton: does certification tell the whole story? Organic certification can provide useful evidence about how cotton was grown under a defined standard. It helps buyers distinguish certified material from cotton for which an equivalent claim has not been demonstrated. India has a voluntary Standard for Chain of Custody for Indian Organic Fibres and Products, introduced under the National Programme for Organic Production. The system sets requirements for certified fibre, processing, handling and documentation, including transaction certificates for consignments moving through different processing units. It is designed to help maintain the integrity of organic material as it moves through the supply chain.  However, certification should not be treated as proof of every environmental benefit a brand might claim. A certificate does not automatically establish the water footprint of a finished shirt, the full chemical profile of its processing, its durability or the income received by the farmer. A 2025 systematic review of 20 cotton life-cycle assessment studies highlights why the distinction matters. The review found that organic cotton farming could have lower environmental impacts per unit of cultivated area, but higher impacts per unit of cotton mass in some comparisons, partly because organic systems may produce lower yields. The result depends on the measurement unit, farming conditions and impact being assessed. The review also identifies processing and consumer care, including washing and drying, as important parts of the wider lifecycle.  This does not mean organic cotton is inherently worse or that certification is unhelpful. It means that a single label cannot answer every question. Certification specialists may argue that standards and audits provide a practical foundation for accountability. Brands may point to certification as a way to manage complex supply chains. But maintaining records and separate material flows can involve costs, particularly for smaller suppliers. The reporting should examine what certification proves, what it leaves unmeasured and whether its requirements are practical for farmers and businesses. The key question is whether the claim on the garment is supported by the relevant records - and whether the brand explains the limits of that claim. Pesticides and farmer income: who bears the cost of cotton? Cotton farmers must manage pests, weeds, unpredictable weather and production costs. Their decisions are shaped by available advice, labour, seeds, inputs and reliable buyers. Reporting on pesticide use must recognise these pressures rather than treating farmers as the sole cause of environmental harm. Pesticide use can create risks for farm workers, nearby communities, soil and water when products are applied or handled improperly. Yet pesticide runoff at a particular location must be established through appropriate sampling and testing, not inferred from the mere presence of cotton cultivation. Research offers evidence that alternative approaches can be worth examining. A field study conducted during the 2022–2024 rainy seasons in Khandwa district, Madhya Pradesh, evaluated integrated pest management in Bt cotton. It reported a 46.55% reduction in pesticide sprays, a 25.38% increase in seed-cotton yield and net returns more than 56% higher than under the farmers’ usual practices. The findings support further investigation of integrated pest management, but they do not establish that the same outcomes have already been achieved across Vidarbha.  For farmers, however, the question is not simply whether a method is environmentally preferable. It must also be practical and financially viable. An alternative may require new equipment, training, additional labour or different timing. Farmers need to know whether the expected benefits outweigh those costs and whether buyers will reward the effort. This is why farmer net returns deserve particular attention. A higher selling price does not necessarily mean a higher profit. Seed, fertiliser, pesticide, irrigation, labour, transport, interest and other costs affect what remains after harvest. The investigation should compare production costs with sale receipts and, where possible, payments under procurement arrangements. It should ask whether certified cotton earns a premium, whether that premium reaches the farmer after intermediary costs, and whether growers face additional expenses to meet sourcing requirements. A brand may describe its sourcing as responsible, but the claim means little economically if the farmer cannot demonstrate a fair or reliable return. Equally, a sourcing programme should not be dismissed simply because it has documentation costs. The relevant question is whether the arrangement provides verifiable environmental and livelihood benefits, and who bears the cost of achieving them. From Vidarbha to the export house Cotton may pass through several businesses before it becomes a shirt. It can be sold to a ginner, processed into fibre, spun into yarn, woven or knitted into fabric, dyed and finished, cut and stitched into a garment, and then supplied to a retailer or export house. At each stage, material may be combined, processed or transferred to another operator. This makes chain-of-custody evidence central to claims that a garment contains cotton from a particular farm, region or certified source. India’s Kasturi Cotton Bharat programme is one example of an effort to strengthen traceability and certification. A Ministry of Textiles backgrounder reported that, as of 30 June 2026, 3,29,550 bales had been certified under the programme and 116 units had renewed registration. The initiative describes QR-based certification and blockchain technology as part of its traceability approach. These figures show activity within the programme; they do not prove that any particular retail shirt contains cotton from a named farm. Product-level claims require product-level evidence.  For this story, the evidence trail should connect the farm or producer group to the ginner, spinner, fabric maker, processor, garment manufacturer and exporter. Purchase orders, invoices, batch identifiers, processing records, certification documents and transaction records can help establish whether the material remained traceable through these stages. It is also important to distinguish physical traceability from systems that reconcile certified inputs and outputs through records. A company must explain which system it uses and what that system proves. A certificate may establish compliance with a particular standard, but it should not be presented as proof of every environmental or social benefit. Different stakeholders may judge the same sourcing system differently. Exporters may prioritise consistent quality, timely delivery and competitive pricing. Weavers may focus on yarn quality, fabric performance and reliable supply. Farmers may be concerned with crop risks, production costs and the price received. Certification specialists may emphasise standards, documentation and auditability. These priorities can overlap, but they can also conflict. Stronger traceability may improve accountability while increasing administrative costs. A sustainability premium may help farmers, but only if it is passed through transparently. A certified material may satisfy a buyer’s sourcing requirements without establishing that every stage of processing has a lower environmental impact. The reporting should test these competing perspectives against documents and evidence rather than assuming that either a certificate or a criticism settles the question. Blends, Durability and the Clothes We Keep The fibre content of a shirt is another important part of its sustainability profile. A garment marketed as cotton may contain a blend of different fibres, making its exact composition important. Blended fabrics can offer practical benefits, including stretch, better shape retention and reduced creasing. However, their environmental impact depends on the materials used, how the garment is constructed, how long it lasts, how it must be cared for and what options are available when it reaches the end of its useful life. Cotton is not automatically the best choice for every purpose, just as a synthetic blend is not automatically the worst. A meaningful comparison must consider what the garment is designed to do, how long it is likely to last, how frequently it will be worn and what happens when it is no longer usable. Durability deserves greater attention during festive shopping. A shirt that is worn repeatedly and repaired when needed may offer better value than one that loses its shape, tears or is discarded after only a few uses. However, durability claims should also be examined rather than accepted at face value. Fabric specifications, seam strength, shrinkage, colourfastness, care instructions and repair options can all help indicate how well a garment is likely to last. The same scrutiny should apply to claims about recycled content or easy recyclability. A fabric’s composition can determine how easily its fibres can be separated and recovered. Consumers should not assume that a blended garment can be recycled simply because one of its materials is recyclable on its own. The wider life cycle matters too. A garment’s environmental footprint extends beyond cotton cultivation. Processing, manufacturing, transport, washing, drying, repair and disposal all contribute to its overall impact. A 2025 systematic review of cotton life-cycle assessments highlights the importance of examining these stages together rather than judging sustainability by the raw material alone. What Should Shoppers Ask Before Buying Festive Clothes? Consumers cannot inspect an entire supply chain while shopping, but they can ask more informed questions: What is the exact fibre composition? Check whether the garment is made from pure cotton or a blend of different fibres.Is the organic or sustainability claim certified? Look for a valid certificate and understand what it actually covers.Can the brand explain its sourcing? Ask whether the cotton can be traced from the farm to the finished garment.What is known about water and chemical management? Look for specific evidence rather than broad environmental promises.Is the garment built to last? Consider the fabric quality, stitching, care instructions and availability of repair options.Does the company explain the returns to farmers? Responsible-sourcing claims should not overlook the economic realities faced by growers.What happens when the garment is no longer usable? Check whether repair, reuse or recycling options are realistically available. Brands should explain the scope of their sustainability claims in clear, accessible language. Where supporting evidence is unavailable, that limitation should be acknowledged rather than concealed behind terms such as “green”, “natural” or “conscious”. For businesses, stronger traceability can be more than a compliance exercise. Reliable records can help identify supply-chain risks, respond to buyer requirements and distinguish documented performance from marketing claims. However, the cost of certification and documentation also matters. A credible sourcing model should consider whether smaller farmers and suppliers can participate without facing a disproportionate financial or administrative burden. Following World Cotton Day, the central lesson is clear: cotton may be natural, but its sustainability must be demonstrated. It depends on how the crop is grown, how farmers and workers are treated, how the material is processed, how long the garment lasts and whether its environmental claims can be verified. The next time a shirt carries a sustainability label, the most useful question is not simply what the label says. It is what evidence stands behind it.Sources FAO — Cotton: Markets and Trade. Background on cotton’s role in livelihoods, employment, trade and competition with other fibres. https://www.fao.org/markets-and-trade/commodities-overview/fibres/enFAO — World Cotton Day, 7 October. Background on the annual observance and the 2026 theme, Cotton for Good: Building Prosperity Through Trade, Transformation and Partnership. https://www.fao.org/world-cotton-day/world-cotton-day-7-october/3/enAPEDA / National Programme for Organic Production — Chain of Custody for Indian Organic Fibres and Products. Requirements for certified organic fibre and supply-chain documentation. https://npop.apeda.gov.in/sites/default/files/announcements/Notifications_organic_textiles_1402202011032020.pdfVitale et al., Journal of Agriculture and Food Research (2025) — “Environmental sustainability of cotton: a systematic literature review of life cycle assessments.” Review of environmental impacts across cotton cultivation, processing and use. https://doi.org/10.1016/j.jafr.2025.102069Bhargavi, Blaise and Nalayini, Cleaner Water (2025) — “Water footprint, runoff and soil loss assessment of cotton production in central India.” Study of rain-fed and drip-irrigated cotton under the conditions examined. https://www.sciencedirect.com/science/article/pii/S2950263225000572Kumar et al., The Indian Journal of Agricultural Sciences — “Field validation of integrated pest management strategy in Bt cotton under farmers’ participatory mode in central India.” Study of integrated pest management in Khandwa, Madhya Pradesh, during the 2022–2024 rainy seasons. https://epubs.icar.org.in/index.php/IJAgS/article/view/168748Press Information Bureau, Ministry of Textiles (2026) — Kasturi Cotton Bharat programme background. Programme information and certification figures reported as of 30 June 2026. https://www.pib.gov.in/PressReleasePage.aspx?PRID=2286497 ...Read more

06 Oct 2026

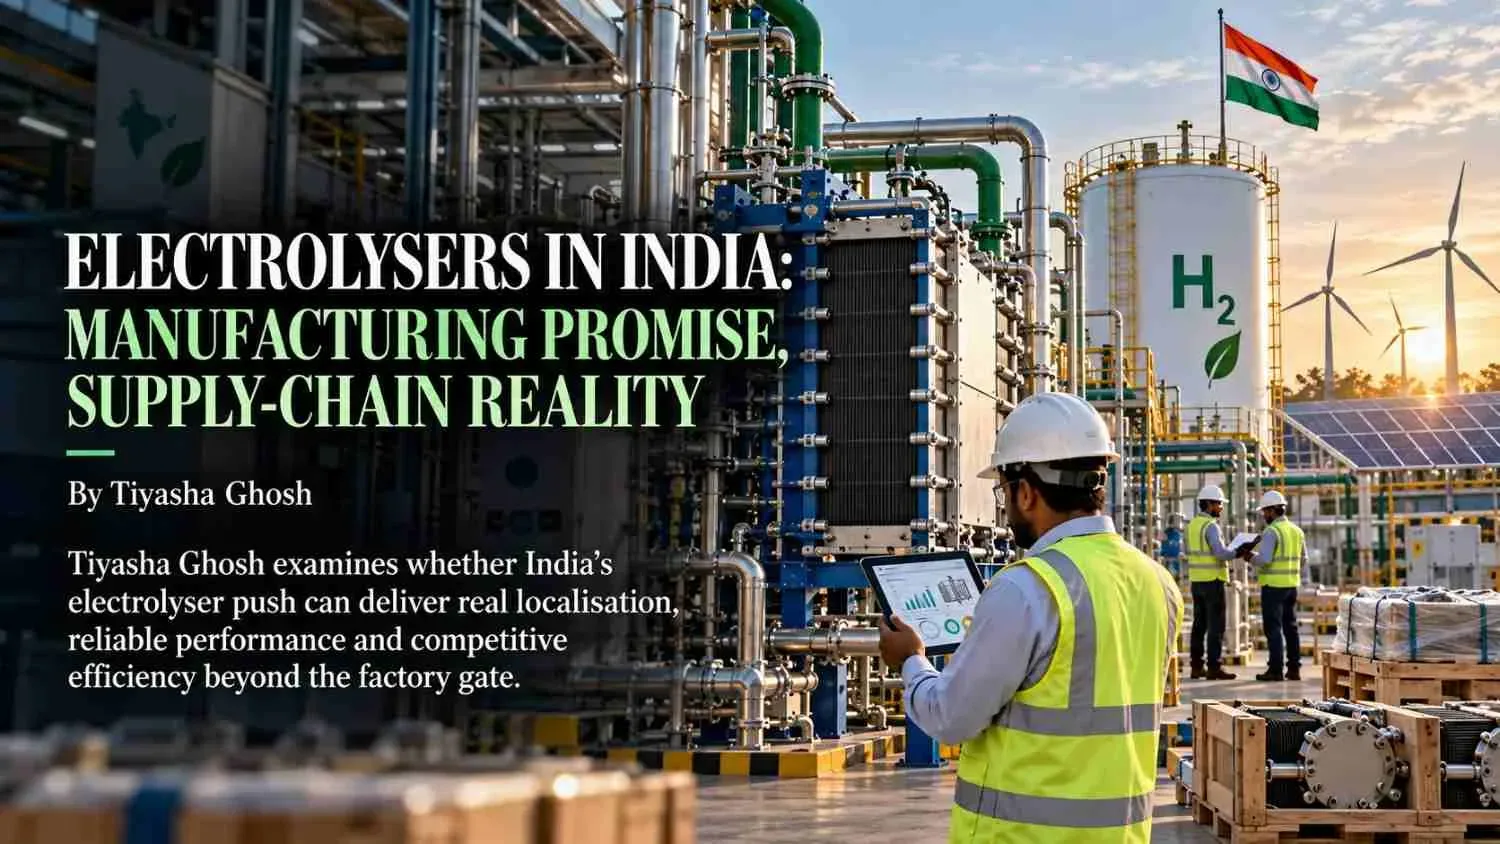
India is building the machines that could power its green-hydrogen ambitions. But the harder test is whether those machines can deliver competitive efficiency, genuine localisation and dependable performance long after the factory gates open. SummaryIndia is rapidly building a domestic electrolyser manufacturing base to support its green-hydrogen ambitions, backed by the National Green Hydrogen Mission and ₹4,440 crore in manufacturing incentives. But approved factory capacity is only the starting point. The real test lies in how much equipment is actually produced, how much of its supply chain is truly local, how efficiently it operates, and whether it can remain reliable and commercially competitive over time. This feature examines the gap between manufacturing promises and operating reality - through localisation, critical minerals, system costs, efficiency, degradation, renewable-power requirements and the evidence buyers should demand before calling an electrolyser truly “Made in India.” THE BIG QUESTION Can India turn electrolyser manufacturing capacity into a genuinely competitive industrial supply chain? India’s green-hydrogen story is gradually becoming a manufacturing story. The country is no longer viewing electrolysers simply as imported equipment required for future hydrogen projects. Through the National Green Hydrogen Mission and its Strategic Interventions for Green Hydrogen Transition (SIGHT) programme, India is seeking to establish a domestic manufacturing base for the equipment that splits water into hydrogen and oxygen. The scale is significant. The National Green Hydrogen Mission aims to position India as a global hub for green hydrogen and targets production of 5 million tonnes per annum by 2030. Under the SIGHT programme, the government has allocated ₹4,440 crore for domestic electrolyser manufacturing. The official MNRE SIGHT portal lists 3,000 MW per year of approved electrolyser manufacturing capacity across two manufacturing tranches: 1,500 MW under Tranche-I and another 1,500 MW under Tranche-II. The headline, therefore, is no longer whether India intends to manufacture electrolysers. It does. The more important question is what exactly “manufacturing” means when the system is examined component by component. INDIA’S ELECTROLYSER MANUFACTURING PUSH Infographic: National Green Hydrogen Mission → SIGHT → Tranche-I: 1,500 MW/year → Tranche-II: 1,500 MW/year → 3,000 MW/year approved capacity Callout: How much of that capacity will translate into actual production? Note: Clearly label 3,000 MW as approved/awarded manufacturing capacity, not equipment produced. FROM HYDROGEN TARGET TO FACTORY FLOOR An electrolyser is deceptively simple in principle. Electricity is passed through water, triggering an electrochemical reaction that separates hydrogen from oxygen. But the machine performing that reaction is a sophisticated industrial system involving a stack, electrodes, catalysts, membranes or diaphragms, bipolar plates, power electronics, pumps, heat-management systems, controls and other balance-of-plant equipment. And not every electrolyser is the same. Alkaline, PEM, solid-oxide and emerging AEM technologies use different materials, designs and operating characteristics. Their supply chains can therefore look very different. This matters because a factory producing an electrolyser system is not necessarily producing every critical component within it. A system can be assembled domestically while some of its most specialised inputs remain imported. That distinction lies at the centre of India’s manufacturing challenge. The policy objective, therefore, is not simply to increase the number of machines carrying a “Made in India” label. It is to build an industrial ecosystem capable of producing reliable equipment at competitive cost while reducing vulnerable import dependencies. The editorial brief for this feature identifies precisely these tests: quality, localisation, minerals, efficiency and after-sales performance—not factory ribbon-cutting. CAPACITY IS NOT THE SAME AS OUTPUT The first number any manufacturing story tends to celebrate is capacity. But capacity is only the beginning. A manufacturer may announce a plant with a particular annual nameplate capacity. A government tender may award manufacturing capacity. A facility may be constructed. Equipment may be installed. Production may begin. These are different stages. For this story, the useful ladder is: ANNOUNCED → AWARDED → BUILT → COMMISSIONED → PRODUCING → SOLD → INSTALLED → OPERATING → MAINTAINED → MEASURED The MNRE portal lists eight Tranche-I projects with scheduled commissioning dates in August 2026, while the listed Tranche-II projects have a scheduled commissioning date of 26 March 2027. As of October 2026, however, a scheduled commissioning date should not automatically be interpreted as evidence of actual commercial output. The evidence threshold must be higher. India’s electrolyser manufacturing progress should increasingly be measured through harder indicators: How much capacity has been physically commissioned?How much equipment has actually been produced?What is the plant’s utilisation rate?How many stacks or systems have been sold?Where are they operating?What is their measured efficiency?How quickly does performance degrade?What does the warranty cover?Which components are domestically sourced?Which remain imported?How quickly can replacement parts be supplied?This is where the story moves from industrial policy to industrial reality. CAPACITY ≠ OUTPUT Status ladder: Announced → Awarded → Built → Commissioned → Producing → Sold → Operating → Measured Centre callout: 3,000 MW/year = approved manufacturing capacity, not 3,000 MW produced. WHAT DOES “MADE IN INDIA” REALLY MEAN? The phrase sounds straightforward. The supply chain is not. A complete electrolyser system can contain dozens of components and materials, and the domestic share can differ substantially between technologies. A 2024 CEEW assessment examined PEM, alkaline and solid-oxide electrolysers and found substantial potential for localisation across all three. It estimated overall indigenisation potential at 82% for PEM, 88% for alkaline and 85% for solid-oxide electrolysers. The report also identified specialised materials and critical minerals as continuing supply-chain challenges. The distinction is crucial: Potential indigenisation is not the same as current indigenisation. The CEEW assessment estimated manufacturing costs of roughly USD 350–400 per kW across the technologies it studied and identified opportunities to reduce stack costs through higher current density, lower catalyst loading, thinner coatings and alternative materials. For PEM systems, the report found that around 72% of manufacturing cost could be readily indigenised in its assessment, while components such as Nafion membranes and minerals including platinum and iridium remained areas of import dependence. For alkaline systems, the picture is different but still not completely domestic. The CEEW analysis identified opportunities to manufacture or process several components in India while pointing to continuing dependence on imported materials and commodities. So the question should move from: “How much of the electrolyser is Indian?” to: “Which parts are Indian, which are imported, and which supply chains could become bottlenecks as production scales?” That is a much more useful manufacturing question. WHAT ACTUALLY SITS INSIDE AN ELECTROLYSER? Technical cutaway: Stack, electrodes, catalyst, membrane/diaphragm, bipolar plates, power electronics, water treatment, cooling, gas handling and controls. Show two labels: Domestic manufacturing potential | Import / critical-material exposure Callout: “Made in India” is a supply-chain question, not just an assembly question. THE CRITICAL-MINERAL QUESTION The localisation debate cannot stop at factories. It has to reach the materials inside those factories. Electrolyser technologies use different combinations of materials, and some specialised components rely on minerals for which India does not have sufficient domestic resources or established supply chains. This creates a strategic dilemma. Trying to manufacture everything domestically may not always be technically or economically sensible. But relying heavily on a narrow group of foreign suppliers can create another vulnerability. The better objective is therefore supply-chain resilience. That can mean: developing domestic component manufacturing;processing imported raw materials within India where economically viable;reducing the quantity of critical minerals required per unit of hydrogen;developing alternative materials;diversifying international suppliers;building domestic testing and certification capabilities;investing in research into next-generation electrolyser technologies.The CEEW study specifically identifies reduced catalyst loading, alternative materials and technology development as potential routes to lower costs and increase localisation. The strategic question is not whether India can eliminate every import. It is whether India can prevent one imported component, mineral or technology from becoming a single point of failure. THE HIDDEN COST: THE SYSTEM AROUND THE STACK Another reason headline manufacturing capacity can be misleading is that the stack is only one part of the overall economics. CEEW’s assessment found that balance of plant can account for 50–60% of the total electrolyser system cost. That changes the procurement conversation. A buyer should not compare two electrolysers simply by comparing the quoted price of their stacks. The relevant comparison is the complete system. That includes: STACK + POWER ELECTRONICS + WATER TREATMENT + COOLING + GAS PROCESSING + CONTROLS + INSTALLATION + MAINTENANCE + REPLACEMENT + FINANCING A cheaper machine that consumes more electricity, degrades faster or requires expensive imported replacement parts may not remain cheaper over its operating life. The real metric is therefore not simply: ₹ per kW of electrolyser but increasingly: ₹ per kilogram of hydrogen over the operating life of the system. That is where manufacturing competitiveness becomes commercial competitiveness. THE STACK IS ONLY PART OF THE BILL Infographic: Stack + power conversion + water treatment + cooling + gas handling + controls + installation + maintenance. Highlight: Balance of plant = 50–60% of total system cost Bottom line: Purchase price ≠ lifetime cost EFFICIENCY: THE NUMBER THAT NEEDS A COMMON RULE Efficiency sounds like a simple number. In practice, it requires a common measurement framework. Two manufacturers can describe system performance differently depending on what is included in the calculation, how electricity consumption is measured and under what operating conditions the test is performed. That makes standardisation critical. A June 2025 BIS draft standard on efficiency assessment of AEM, PEM and alkaline water electrolysers note that different electrolyser technologies have different configurations, materials, operating conditions and performance characteristics. It also states that meaningful comparison requires a standardised procedure for evaluating system performance. The document highlights another important complication: some performance characteristics can be assessed during initial testing, while aspects related to equipment life become clearer only through operation and accelerated testing. For buyers, therefore, the important question is not merely: “What efficiency does the manufacturer claim?” It is: “Under what test protocol was that efficiency measured, at what load, and which parts of the system were included?” Without comparable testing, headline efficiency numbers can be difficult to use in procurement decisions. WHEN TWO EFFICIENCY NUMBERS ARE NOT COMPARABLE Comparison graphic: Two illustrative electrolyser test cards showing: Efficiency → Operating load → Temperature → Pressure → System boundary Centre: STANDARDISED TESTING Note: Do not use invented manufacturer numbers. THE PERFORMANCE TEST DOES NOT END WHEN THE MACHINE STARTS An electrolyser can perform well when new and still become a different economic proposition several years later. That makes degradation one of the most important—and least headline-friendly—questions in the sector. A serious buyer needs to know: How quickly does stack performance decline?What operating conditions accelerate degradation?How frequently does the stack need replacement?What is covered under warranty?What happens when efficiency falls below the guaranteed level?Who supplies replacement components?How long will critical spare parts remain available?Who carries the performance risk?These questions matter because hydrogen projects are not buying a machine for a photograph. They are buying an operating asset. If an electrolyser is expected to function for years, uptime, degradation and service availability can ultimately matter as much as its initial purchase price. The editorial brief therefore calls specifically for degradation data, warranty claims and signed customer orders, rather than relying only on factory-capacity claims. THE RENEWABLE POWER QUESTION There is another part of the electrolyser equation that sits outside the factory. Electricity. Green hydrogen is only as credible and economically viable as the renewable electricity system supporting its production. An electrolyser may be technically excellent, but its economics can deteriorate if the electricity feeding it is expensive, unreliable or poorly matched to its operating profile. This creates a second test for Indian manufacturing. Can domestically manufactured electrolysers operate efficiently under the actual renewable-power conditions that Indian projects will face? Solar-heavy systems, for example, can experience changing electricity availability throughout the day. That makes dynamic operation, power-electronics performance and degradation behaviour important procurement considerations. The machine therefore cannot be assessed in isolation. The chain is: RENEWABLE ELECTRICITY → WATER → ELECTROLYSER → HYDROGEN → STORAGE / TRANSPORT → INDUSTRIAL CUSTOMER A weakness anywhere along that chain can affect the economics of the final kilogram of hydrogen. THE HYDROGEN MOLECULE’S FULL ITINERARY Systems map: Renewable electricity → Water → Electrolyser → Hydrogen conditioning → Storage → Transport → Industrial buyer Under each stage, ask one short question: Power: Affordable? Water: Available? Electrolyser: Who made it? Performance: How efficient? Storage: What infrastructure? Transport: What cost? Buyer: Who pays? Callout: A green-hydrogen project is a chain, not a machine. INDIA’S ADVANTAGE — AND ITS COMPETITIVE PROBLEM India has a major reason to pursue domestic electrolyser manufacturing. It wants the economic benefits of the green-hydrogen transition to extend beyond hydrogen production itself into manufacturing, engineering, components, services and jobs. But the global market is already competitive. The International Energy Agency’s Global Hydrogen Review 2026 reports that installed global electrolysis capacity doubled in 2025 to more than 4 GW, with China accounting for nearly three-quarters of new installations. The IEA also says electrolyser manufacturing is entering a consolidation phase as market development remains slow. That creates a difficult environment for India. The country is attempting to build manufacturing capacity while the global industry itself is still searching for stable demand and sustainable economics. The challenge is therefore not simply to make electrolysers. It is to make them: CHEAP ENOUGH. EFFICIENT ENOUGH. RELIABLE ENOUGH. SERVICEABLE ENOUGH. to win real orders. That is a much higher bar. THE GLOBAL ELECTROLYSER RACE Global map: Highlight India and China. Show the comparison around: Scale | Cost | Technology | Project experience | Domestic demand | Export potential Bottom line: The competition is for cost, scale, reliability and customers—not just technology. THE GLOBAL LESSON: CHEAP EQUIPMENT IS NOT THE WHOLE STORY China’s position provides an important comparison. The IEA reports that China has become the leading centre for electrolyser deployment and manufacturing, benefiting from lower technology costs and experience with large projects. But the same analysis points to excess capacity and market consolidation. The lesson for India is not that domestic manufacturers must simply imitate China. It is that manufacturing scale alone does not guarantee sustainable industrial competitiveness. A country can have factories and still struggle with: weak demand;underutilised capacity;thin margins;imported critical components;insufficient testing infrastructure;limited after-sales networks;technology dependence;financing constraints;inadequate customer confidence. The strongest industrial ecosystem is therefore not necessarily the one with the largest announced factory capacity. It is the one whose manufacturers can continue delivering after subsidies, incentives and policy headlines become less central to the business case. THE REAL PROCUREMENT TEST For developers and industrial buyers, the questions should become more demanding. Before purchasing an electrolyser, a buyer should be able to request a documentary record covering at least: 1. FACTORY CAPACITY What is the annual nameplate capacity, and what is the actual production? 2. BILL OF MATERIALS What are the major components, and where does each come from? 3. TECHNOLOGY Is the system alkaline, PEM, SOEC, AEM or another configuration? 4. EFFICIENCY What test protocol produced the quoted efficiency figure? 5. DEGRADATION What performance decline is expected over time? 6. WARRANTY What exactly is guaranteed, for how long and under what operating conditions? 7. WATER What water quality does the system require, and what treatment infrastructure is necessary? 8. OPERATING EVIDENCE How many systems are actually operating, and for how long? 9. CUSTOMER EVIDENCE Are there signed customer orders rather than only memoranda or announcements? 10. LIFETIME ECONOMICS What is the expected total cost of producing hydrogen over the equipment’s operating life? This is the point where “Made in India” becomes a measurable industrial proposition rather than a branding exercise. BEFORE BUYING AN ELECTROLYSER, ASK FOR THE FILE ☐ Factory capacity vs. actual output ☐ Bill of materials ☐ Supplier origin ☐ Technology / chemistry ☐ Efficiency test protocol ☐ Degradation data ☐ Warranty terms ☐ Water requirement ☐ Operating customer evidence ☐ Lifetime hydrogen cost Callout: If the number matters to the business case, ask for the document behind the number. WHAT SHOULD INDIA MEASURE NEXT? India’s next manufacturing phase should be judged through a different dashboard. Not just: MW OF ANNOUNCED CAPACITY but: MW COMMISSIONED MW ACTUALLY PRODUCING UTILISATION RATE PERCENTAGE OF COMPONENTS LOCALLY SOURCED CRITICAL-MATERIAL EXPOSURE MEASURED SYSTEM EFFICIENCY ANNUAL DEGRADATION STACK REPLACEMENT INTERVAL WARRANTY PERFORMANCE NUMBER OF OPERATING CUSTOMER SYSTEMS SYSTEM AVAILABILITY COST PER KILOGRAM OF HYDROGEN These indicators would reveal whether the domestic electrolyser industry is moving from policy-supported capacity creation towards commercially durable manufacturing. The government intervention has already created a strong market signal: according to MNRE, 15 companies have been awarded 3,000 MW/year of electrolyser manufacturing capacity with ₹4,440 crore in total incentives. The next phase is about proving what those numbers produce in practice. FROM ANNOUNCEMENTS TO OPERATING DATA OLD MEASUREBETTER MEASUREAnnounced MWCommissioned MWFactory capacityActual outputLocal assemblyLocal component shareClaimed efficiencyStandardised tested efficiencyNew equipmentOperating equipmentPurchase priceLifetime costWarranty promiseWarranty performanceCustomer announcementSigned order + operating evidence THE BUSINESS CASE BEHIND THE CLIMATE CASE There is a tendency to frame green hydrogen as a climate technology first and an industrial technology second. For electrolysers, the order increasingly needs to be reversed. The climate ambition depends on industrial performance. If electrolysers are expensive, inefficient or unreliable, green hydrogen becomes more expensive. If green hydrogen remains expensive, demand can remain weak. If demand remains weak, manufacturing plants can operate below capacity. If factories operate below capacity, domestic suppliers struggle to build economies of scale. And if component suppliers cannot scale, import dependence can persist. That creates a cycle: HIGH EQUIPMENT COST ↓ EXPENSIVE HYDROGEN ↓ WEAK DEMAND ↓ LOW FACTORY UTILISATION ↓ LIMITED SCALE ↓ WEAK SUPPLY CHAIN India needs to build the opposite cycle: RELIABLE EQUIPMENT ↓ COMPETITIVE HYDROGEN ↓ STRONGER DEMAND ↓ HIGHER UTILISATION ↓ SUPPLIER SCALE ↓ LOWER COST ↓ STRONGER DOMESTIC INDUSTRY That is the real industrial prize. THE BUSINESS-CASE CYCLE Risk cycle: High cost → Expensive hydrogen → Weak demand → Underused factories → Weak supply chain Industrial cycle: Reliable equipment → Competitive hydrogen → Demand → Scale → Lower cost → Stronger industry Centre question: Which cycle will India’s electrolyser industry enter? WHAT THE EVIDENCE SHOULD LOOK LIKE The strongest version of this story is not built around the number of factories announced. It is built around documents. For each major manufacturing claim, the evidence hierarchy should move from: Policy announcement → Letter of award → Factory commissioning evidence → Production data → Customer order → Operating data → Performance data → Independent verification, where available This distinction matters because announcements are not equivalent to operational outcomes. For this reason, the article should not claim that every SIGHT-listed factory is already producing at its awarded capacity unless documentary evidence establishes that. The absence of such evidence is itself important. It tells the reader where India’s manufacturing story currently has a measurement gap. THE EVIDENCE LADDER Announced → Awarded → Commissioned → Producing → Operating → Measured → Independently verified Callout: The higher the evidence, the stronger the claim. THE BOTTOM LINE India has moved beyond the stage where electrolyser manufacturing is merely an aspiration. Policy support exists. Manufacturing capacity has been awarded. Companies are developing production capabilities. The potential for substantial localisation is real. But: CAPACITY IS NOT YET COMPETITIVENESS. A factory can have a nameplate capacity without producing at that level. A machine can be assembled domestically while relying on imported critical components. A low purchase price can conceal higher lifetime electricity, maintenance or replacement costs. And a promising technology can still struggle if customers cannot secure affordable renewable electricity or dependable long-term service. The next chapter of India’s electrolyser story therefore needs fewer ribbon-cutting numbers and more operating numbers. The decisive evidence will come from: production records, component origins, standardised efficiency tests, degradation data, warranties, customer orders, operating experience and lifetime cost. India does not simply need electrolyser factories. It needs an electrolyser industry that can: SURVIVE AFTER INCENTIVES. COMPETE AFTER HEADLINES. PERFORM LONG AFTER THE RIBBON IS CUT. Because a factory can make a stack. The real question is whether the stack can make a business case.SOURCES & DOCUMENTATION: Ministry of New and Renewable Energy — National Green Hydrogen Mission / SIGHT approved projects MNRE National Green Hydrogen Mission — SIGHTMinistry of New and Renewable Energy — SIGHT Supply Incentives MNRE — SIGHT Supply IncentivesPress Information Bureau / MNRE — National Green Hydrogen Mission progress PIB — National Green Hydrogen Mission progressPress Information Bureau / MNRE — Green Hydrogen expansion and electrolyser manufacturing PIB — Green Hydrogen expansion and electrolyser manufacturingMNRE — India's Green Hydrogen Revolution MNRE — India's Green Hydrogen RevolutionCouncil on Energy, Environment and Water — How can Hydrogen Electrolysers be Made in India? CEEW — Hydrogen Electrolyser Manufacturing in IndiaInternational Energy Agency — Global Hydrogen Review 2026 IEA — Global Hydrogen Review 2026International Energy Agency — Global Hydrogen Review 2026: Production IEA — Global Hydrogen Review 2026: ProductionBureau of Indian Standards — Draft efficiency assessment standard for electrolysers BIS — Draft efficiency assessment standard ...Read more

24 Sep 2026

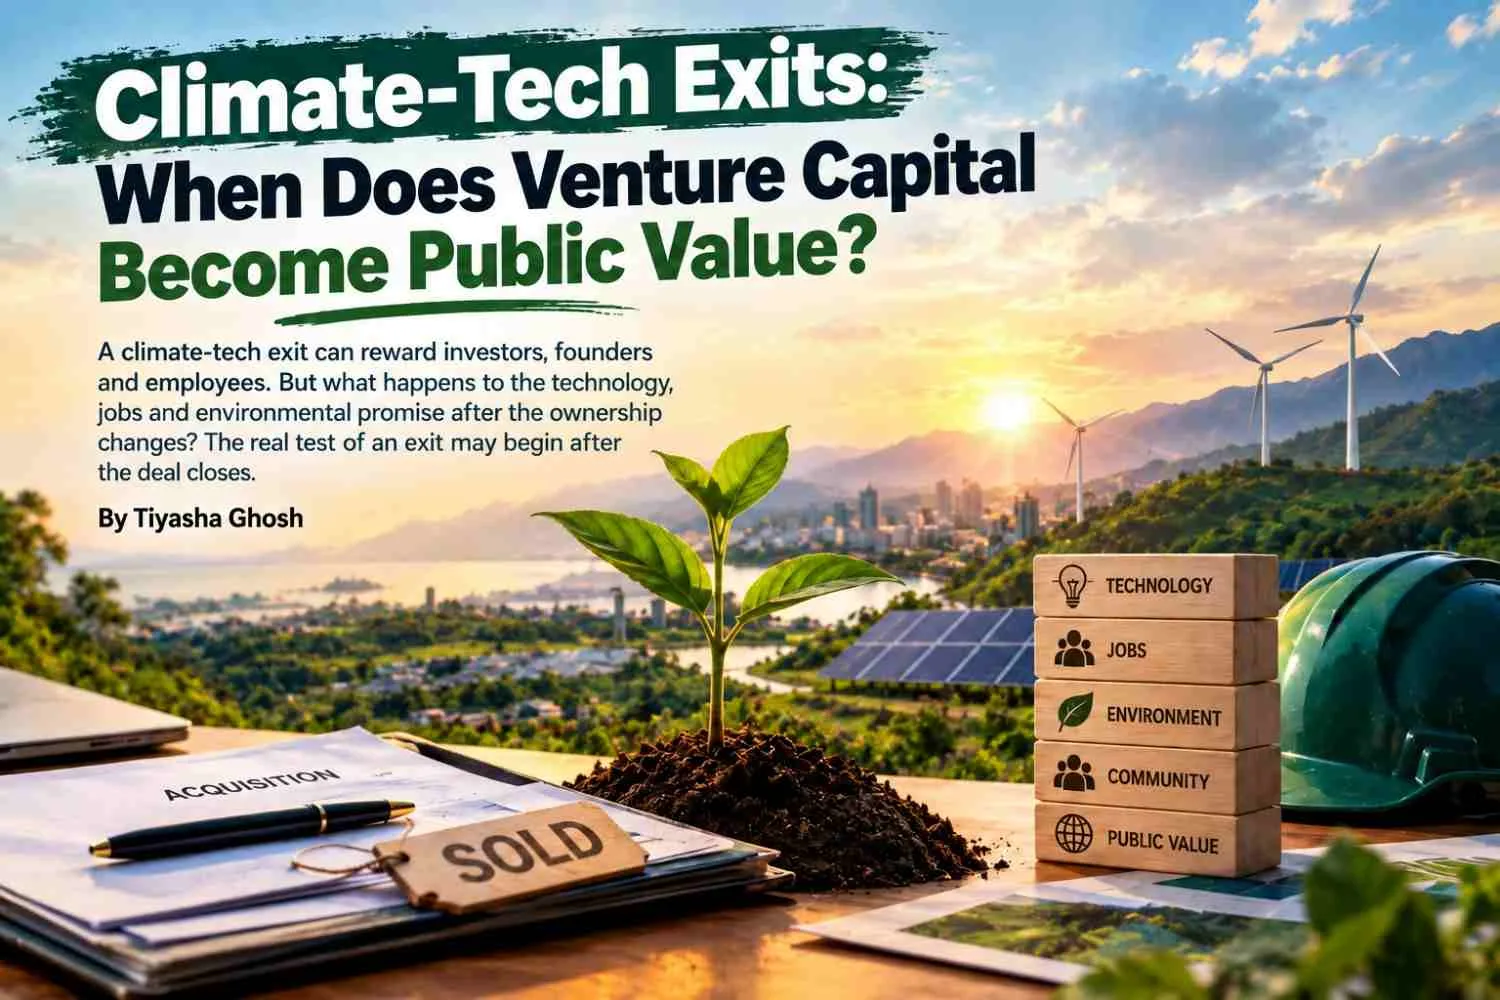
September 24, 2026 | Kolkata A climate-tech exit can reward investors, founders and employees. But what happens to the technology, jobs and environmental promise after the ownership changes? The real test of an exit may begin after the deal closes. SummaryIndia's climate-tech sector is attracting increasingly large pools of capital, but the money is becoming concentrated in fewer, more mature companies. Tracxn data reported in June 2026 showed that Indian climate-tech startups had raised about $12.8 billion across 1,583 startups over 17 years, while the first five months of 2026 alone saw $791 million across 74 funding rounds. Yet $524 million of that 2026 funding went into just five late-stage deals, while 44 seed-stage rounds together raised only $61 million. That makes exits important. A successful acquisition or secondary sale can return capital and create a pathway for new investment. But a deal can also transfer intellectual property, change product priorities, reduce jobs, alter customer access or leave publicly supported technology underused. A shutdown can be even more revealing: the financial investment may disappear while the climate problem remains. The question, therefore, is not simply whether investors made money. It is whether the climate solution continued to create public value after the term sheet changed hands. What Does a Climate-Tech Exit Really Mean? For venture capital, an exit is typically the point at which an investment becomes liquid. A fund invests in a company, the company grows, and eventually another investor, a strategic buyer or the public market provides a route for the original investor to sell its stake and realise returns. That, in itself, is not a problem. In fact, exits are an essential part of a functioning investment ecosystem. If investors cannot eventually return capital to their limited partners, they have less incentive to keep backing young companies that carry high levels of risk. This matters even more in climate technology, where the path from innovation to commercial viability can be long and expensive. A climate-tech company may spend years developing batteries, carbon-removal systems, energy-efficiency solutions, waste-management platforms, sustainable materials or agricultural technologies before generating reliable revenue. Unlike conventional software businesses, many of these technologies require significant research, physical infrastructure, testing and deployment before they can reach scale. India’s current funding pattern shows why the exit question matters. The country has attracted $12.8 billion in climate-tech funding across 1,583 startups, according to Tracxn data reported in June 2026. But between January and May 2026, just $791 million was raised across 74 funding rounds. Late-stage companies accounted for $524 million across only five deals, while 44 seed-stage rounds together raised just $61 million. The figures point to a clear tension: capital is available, but access to it is becoming increasingly concentrated as companies move through the startup lifecycle. Against this backdrop, a successful exit can reasonably be seen by investors as evidence that climate technology is becoming commercially investable. It can return capital to early investors, bring new money into the company and potentially create the conditions for further investment in the sector. But financial success is only one measure of an exit. The harder public-interest question begins after the deal closes: What happens to the climate solution once the investor leaves? Can Exits Keep Climate Capital Moving? There is a strong argument that they can. For the climate-tech ecosystem, a successful exit can do more than reward an early investor. It can create a pathway for capital to move from one generation of companies to the next. Consider Battery Smart. Green Frontier Capital invested in the EV battery-swapping company at an early stage and exited during its $65-million Series B in 2024. The round included both primary and secondary capital and was led by LeapFrog Investments. Inc42 reported that Green Frontier achieved roughly an 18x return, while Orios Venture Partners also made a partial exit. For an early-stage fund, this is essentially how the venture-capital cycle is designed to work. An investor takes on the risk at an early stage, the company grows, a growth-stage investor enters, and the original investor eventually gets liquidity. The company, meanwhile, gains access to new capital that can support its next phase of expansion. The returns generated by the early investment can then be deployed into another young company. Green Frontier Capital has itself described the Battery Smart exit as part of its broader climate-investment strategy, while its investment activity in 2026 indicates that it continues to back Indian climate businesses. This represents the more optimistic version of the exit story. An exit does not necessarily have to mark the end of a climate investment. It can act as a capital-recycling mechanism, allowing money, experience and confidence to move back into the sector. That recycling can have wider effects. Successful exits can strengthen investor confidence, make more capital available to emerging companies, give experienced founders and employees the financial resources to support or build new ventures, and make strategic buyers more willing to acquire climate technologies. Over time, they can also provide evidence that businesses addressing environmental problems can become commercially viable. Climate Policy Initiative’s work highlights the importance of financial instruments that help climate technologies cross difficult stages of development and reach commercialisation. Its Clean Economy Fund, for example, was designed around first-of-a-kind climate technologies and the financing gap faced by companies seeking roughly $1 million to $10 million at the early-growth stage. Under this interpretation, a successful exit can create public value indirectly. The investor receives a return, the company receives fresh capital, and the broader ecosystem potentially gains another source of funding for future climate solutions. But there is an important condition. Capital recycling only creates a stronger climate-tech ecosystem if the capital, expertise and opportunity actually get recycled. When Ownership Changes, Does the Climate Mission Change Too? This is where the standard exit narrative becomes incomplete. A strategic acquisition is not simply a financial transaction; it can also change who owns the technology, who controls the product roadmap, where the intellectual property sits, which customers are prioritised and whether a previously climate-focused product remains strategically important. Take Scorpius Trackers. In February 2025, Gensol Engineering said it had agreed to sell its US subsidiary, Scorpius Trackers, for ₹350 crore to a US renewable-energy company. The transaction included exclusive global intellectual property rights, except in India. Financially, the transaction can be viewed as an asset monetisation and a strategic move. But from an accountability perspective, the more important questions begin after the sale: Does the technology continue to be developed and deployed? What happens to the employees and customers who depend on it? And does the new ownership expand access to the solution or simply consolidate its intellectual property? The answers matter because an acquisition cannot be measured only by its price or the returns it generates. Whether the technology continues to deliver its intended climate impact is what determines whether the transaction creates value beyond the shareholders. What Does Regulation Protect When Climate-Tech Changes Hands? India already has regulatory frameworks governing certain acquisitions and mergers, but these frameworks do not necessarily address whether a climate-focused technology continues to deliver its intended environmental purpose after ownership changes. The Competition Commission of India (CCI) requires qualifying combinations to be notified before they are completed, subject to applicable thresholds and exemptions. Its framework covers acquisitions of control, shares, voting rights and assets, and allows the Commission to modify or prohibit transactions that are likely to cause an appreciable adverse effect on competition. For listed companies, SEBI’s takeover regulations also govern matters related to acquisitions and disclosures. But these mechanisms address questions that are different from the climate-tech accountability question. Competition law focuses on whether a transaction could harm competition. Securities regulation focuses on disclosure and investor protection. Corporate law deals with whether a transaction has been legally structured and approved. The climate-tech question is different: Will the technology continue to deliver what it was developed to deliver? That question becomes particularly relevant because climate technologies often receive public support before they become commercially mature. The Department of Science and Technology’s NIDHI-PRAYAS programme, for instance, supports innovators in converting ideas into prototypes and commercial products, with grants of up to ₹10 lakh. Other public innovation programmes similarly connect government support with technology development and commercialisation. In some government-supported R&D programmes, the conditions go further. MeitY funding terms include provisions relating to intellectual property and commercialisation, including circumstances in which public-interest considerations may allow intervention if technology is not commercialised or national or public interests require it. The point is not that every startup receiving public money should be protected from acquisition. It is that when public funding helps build a technology, there is a legitimate accountability question about what happens to that technology when private ownership changes.  When an Exit Changes More Than Ownership For investors, an exit usually means liquidity. For employees, it can mean something very different. An acquisition can bring ESOP wealth, retention bonuses or new employment opportunities, but it can also lead to restructuring, relocation, layoffs or changes in pay and benefits. Employees may also lose the sense of purpose that drew them to the company in the first place. This distinction matters particularly in climate-tech, where people often join young companies for a combination of salary, equity and purpose. An acquisition may preserve the business while fundamentally changing that relationship between the company and its workforce. A shutdown can be even more disruptive. BluSmart illustrates the other side of the equation. The electric mobility company had raised more than $150 million, operated thousands of EVs and reached significant ride volumes before its business began to unwind in 2025. As its funding problems deepened, the company suspended operations, leaving thousands of vehicles as stranded assets or potential recovery targets for lenders and lessors. Reuters later reported that BluSmart entered insolvency proceedings after operations were suspended, with the crisis also intertwined with governance concerns involving its listed affiliate, Gensol. The case highlights an important distinction: a company can be built around a climate-positive business proposition and still fail as an institution. When that happens, the environmental value created by the business does not automatically move to another owner or operator. The cars may remain. The charging infrastructure may remain. The software may remain. The workers remain. The underlying mobility problem remains. But the company that connected all of these pieces can disappear. That is why shutdowns belong in the climate-tech exit conversation. An exit is not only about who receives the financial returns. It is also about what happens to the technology, people and climate value left behind when the company can no longer carry its mission forward. When a Successful Exit Fails the Climate Test A climate-tech exit can be financially successful and still fall short of its environmental promise. That is the central tension an accountability-focused assessment needs to examine. Consider a hypothetical climate startup that receives government grants, venture capital and corporate pilot contracts to develop a new technology. A large company eventually acquires it. Investors make strong returns, founders gain financially and employees receive value through their ESOPs. The acquisition is announced as a success. But two years later, the picture could look very different. The product may no longer be deployed. Pilot customers may have disappeared. The original team may have been dissolved, while the technology has been absorbed into another platform. The emissions reductions promised during the company’s growth may never have been properly measured, and intellectual property developed with public support may no longer be accessible to the users it was intended to benefit. Financially, the transaction may have worked. Environmentally, the outcome may not have. That is why valuation, investor returns or the headline acquisition price cannot be the only evidence used to judge the success of a climate-tech exit. The real measure is whether the technology continues to create the environmental and public value it was developed to deliver. What Evidence Should Prove a Climate-Tech Exit Worked? An acquisition announcement can tell us who bought the company and how much the deal was worth. It cannot, on its own, tell us what happened to the technology, employees or climate impact afterwards. For that, reporters need a much wider evidence trail. 1. The Deal Start with the terms of the transaction. Were there any impact covenants, deployment targets or commitments to protect jobs? If the company received public funding, were any grant conditions or obligations transferred to the new owner? Was there a commitment to maintain access to the technology? 2. The Technology Establish what the company had actually built before the exit. What technology or intellectual property changed hands? Who were its customers, and how many pilot projects had become paying deployments? These details help distinguish a functioning climate solution from a technology that exists mainly on paper. 3. The Money Follow the capital. How much had the company raised, and how much of the exit involved primary versus secondary capital? How much went to existing shareholders, and how much had actually been invested in product development and deployment? 4. The People An exit can change the workforce as much as it changes ownership. Report how many employees were there before the transaction and how many remain afterwards. Check whether workers received ESOP payouts, were retained or transferred, or faced layoffs. The fate of founders and technical teams can also reveal how much of the original expertise remains with the business. 5. The Public Support Check whether the company received government grants, concessional finance, incubator support or publicly funded R&D. If it did, reporters should examine what obligations or conditions came with that support and what happens to them after ownership changes. 6. The Climate Result Finally, measure the actual environmental outcome. What was the baseline? What changed after deployment? Was the result measured in absolute terms or only as an intensity metric? What methodology was used, and was the result independently verified? Above all, one question should remain central: Was the technology actually deployed and delivering its intended impact after the exit? This follows the SustainVerse evidence standard: every number should have a unit, period, boundary, denominator and source, while announced, contracted, commissioned, operational and measured outcomes must not be treated as interchangeable. A climate-tech exit should therefore be investigated not just through the deal document, but through the evidence of what the deal left behind. Whose Definition of Success Matters After an Exit? “Public value” does not mean the same thing to everyone involved in a climate-tech exit. Investors, founders, employees, customers and public institutions can all look at the same transaction and measure its success differently. Those competing perspectives need to be taken seriously. For investors, a successful exit can itself be seen as part of the value created. Capital needs to be recycled, and a fund that cannot eventually return money to its limited partners may find it harder to raise and deploy new capital. An acquisition can also generate the confidence and financial returns needed to back the next generation of climate startups. For founders, an acquisition may be the most realistic route from a promising pilot to large-scale deployment. A large industrial company may already have factories, customers, procurement networks and international distribution that a startup would struggle to build on its own. From this perspective, selling the company could help a climate solution reach more users rather than weaken its purpose. For employees, the questions are more personal: What happens to their jobs, their equity and the product they spent years building? An exit can create financial gains through ESOPs, but it can also bring restructuring, new ownership terms or changes to the work and mission that attracted them. For customers, the acquisition price may matter less than whether the technology continues to work, whether support and spare parts remain available, and whether the promised savings or environmental benefits actually materialise. For the public-interest side, the concern is whether public support helped create something that continues to be accessible and useful after private ownership changes. If taxpayers helped fund the technology through grants, public R&D or other forms of support, what happens to that value after the exit becomes an important accountability question. These perspectives do not necessarily contradict one another. An exit can generate returns for investors, opportunities for founders and employees, and greater scale for a climate solution at the same time. The real test is whether the claims made by each stakeholder can be matched against the documents, the outcomes and what actually happens after the deal. Why the early-stage funding gap makes this question more urgent The exit debate cannot be separated from the funding pipeline. CPI's Clean Economy Fund identifies a financing gap for Indian climate companies seeking roughly $1 million to $10 million, particularly asset-heavy and IP-led businesses that are too risky for conventional lenders, too capital-intensive for early-stage investors and too small for growth equity. (CPI) That is precisely the stage at which future climate technologies can stall. Meanwhile, India's first five months of 2026 showed the opposite pattern: a large share of climate-tech funding was concentrated in a handful of late-stage deals. (The Economic Times) Rainmatter offers one contrasting philosophy. Its climate investment strategy explicitly describes a 10–15 year lens and says it is not built around quick exits. (mint) Green Frontier Capital presents another model: early-stage investors need realistic exit routes, and its leadership has argued that trade sales or sales to growth-stage investors may be more practical than waiting a decade for an IPO. (YourStory.com) These are not necessarily contradictory. They reveal a genuine debate over the architecture of climate capital: Should climate investors optimise for faster recycling of capital, or for longer holding periods that allow difficult technologies to mature? The answer may depend on the technology. A software-enabled climate platform may scale quickly. A new battery chemistry, industrial decarbonisation process or carbon-removal system may require years of testing, infrastructure and regulatory approval. One exit model cannot fit all of them. What would a better climate-tech exit actually look like? A better exit would not necessarily mean stopping acquisitions. It would mean making the consequences visible. For a company receiving public grants, the exit file could record: Grant → IP → Commercialisation obligation → Acquisition → New owner → Deployment → Outcome For an employee: Joining → ESOP → Exit → Payout/retention → New ownership terms For a community: Pilot → Public support → Technology deployment → Acquisition → Continued access → Measured benefit For an investor: Entry valuation → Capital deployed → Follow-on funding → Exit → Return → Reinvestment And for the climate: Baseline → Technology → Deployment → Emissions/resource outcome → Verification → Post-exit performance That is the timeline the article's visual should eventually show. Not a rising valuation curve. A capital-product-outcome timeline. So, When Does Venture Capital Become Public Value? Venture capital becomes public value when the value created by an investment does not end when the investor exits. An exit matters beyond the transaction itself when financial success continues to produce something useful in the real world. It may mean a climate technology reaches millions of users. It may mean an acquisition gives a promising solution the manufacturing capacity, infrastructure or distribution network it previously lacked. It may mean employees gain financial security through ESOPs and use that experience and capital to build the next generation of climate ventures. It may mean an early-stage investor recycles its returns into another difficult technology that still needs patient capital. These are the ways an exit can extend value beyond the deal. But the opposite must remain just as visible. An exit can concentrate technology. A shutdown can strand valuable assets. A sale can eliminate jobs. A grant-funded innovation can become inaccessible. A high valuation can coexist with weak deployment. And a climate label can survive long after the climate outcome itself has disappeared. This is why the success of a climate-tech exit cannot be understood through valuation, acquisition price or investor returns alone. India’s climate-tech market is growing and its funding base is expanding, but capital is also becoming more selective and increasingly concentrated in later-stage opportunities. As the funding pipeline becomes more selective, the quality and consequences of exits become increasingly important—not simply the number of deals completed. The next phase of India’s green investment story therefore needs a broader definition of success. Not just: How much capital went in? Not just: How much did the investor make? But what happened to the technology? What happened to the people? What happened to the public support behind it? What happened to the promised deployment? And, most importantly, what happened to the climate impact? Because the real measure of an exit is not what the investor takes out of the company. It is what remains after they leave. So, the real exit test is this: What did the world inherit after the investor left?References : Economic Times / ETtech. “India's climate-tech funding reaches $12.8 billion across 1,583 startups & 17 years.” 8 June 2026. Based on Tracxn’s India Climate Tech 2026 Report. Inc42. “Exclusive: Green Frontier Capital Exits Battery Smart With About 18X Returns.” 18 June 2024. Green Frontier Capital. “Battery Smart.” Company portfolio profile and reported deployment/scale data. Reuters. “Indian e-cab provider BluSmart enters insolvency amid corporate governance challenges.” 29 July 2025. ETEnergyWorld. “Gensol signs ₹350 crore agreement to monetize US solar tracker business.” 25 February 2025. Gensol Engineering / National Stock Exchange filing. “Gensol Engineering Unlocks Value with INR 350 Crore Strategic Deal for Scorpius Trackers' US Subsidiary.” 25 February 2025. Climate Policy Initiative (CPI). “Clean Economy Fund.” Information on climate-tech commercialisation and early-growth financing in India. ...Read more

17 Sep 2026

17 September 2026, Cape Town GEC+Africa 2026 brings Africa’s entrepreneurial ecosystem together in Cape Town, connecting startups, investors, policymakers and support networks around a shared vision of inclusive, innovation-led growth. SummaryGEC+Africa 2026 in Cape Town brought together entrepreneurs, investors, policymakers and ecosystem-support organisations from across Africa to strengthen continental connections. The congress focused on turning a fragmented entrepreneurial landscape into a more connected system for capital, knowledge, markets and opportunities. A key development was the launch of KUMii, an AI-powered platform designed to connect businesses with investors, mentors, policymakers and other ecosystem partners. Discussions also highlighted gaps in investment, skills and support for MSMEs, while exploring the role of AI, creative industries, renewable energy and digital innovation in Africa’s growth. The congress placed particular emphasis on inclusive access to finance and the need to strengthen sectors such as agriculture, manufacturing, healthcare and education. Its longer-term impact will depend on whether the conversations and partnerships formed in Cape Town translate into practical pathways that help African businesses scale. Cape Town became a meeting point for Africa’s economic imagination as the Global Entrepreneurship Congress Africa (GEC+Africa) 2026 opened at the Cape Town International Convention Centre under the theme “Connecting Africa”. Hosted by the Global Entrepreneurship Network (GEN) Africa and 22 On Sloane, the 16–17 September congress brings together approximately 2,000 delegates, including more than 1,500 startups and MSMEs, 150 investors, 150 policymakers and 200 ecosystem-support organisations from over 43 African countries. Yet its importance lies not in its scale alone. GEC+Africa is an attempt to turn a fragmented entrepreneurial landscape into a connected continental growth system.  A striking feature of any African get-together from various African nations has a striking pan-African spirit and expression. Global Entrepreneurship Network organized GEC+ for Africa in the Cape Town International Convention Centre in South Africa is no different. Hence it starts with South African anthem and the anthem of the Organization of African Unity. African solidarity song, dance, expression are resplendent in the inaugural session.  The opening carried a distinctly pan-African spirit: local music and dance, the language of solidarity and the insistence that Africa’s future cannot be built through isolated national efforts. Kizito Okechukwu, Co-Chair of GEN Africa and Executive Head of 22 On Sloane, set the direction, while GEN Founder and President Jonathan Ortmans placed African entrepreneurship within a global network of opportunity. Edna Sathekga-Montse, Group Executive for Transformation and Sustainability at African Bank, underlined the financial sector’s responsibility to widen access to capital and support inclusive growth. The GEN Global President Jonathan Ortmans went down the memory lane recollecting the GEC journey in Africa and the remarkable response it has got in the continent in general, and South Africa in particular.  Former South African President Kgalema Motlanthe gave the congress its moral and political centre. Access to finance for African businesses, he argued, must be treated as a right rather than a privilege. Africa’s next transformation, he suggested, will be driven by innovation in the digital, green and social sectors, but only if countries strengthen agriculture, manufacturing, healthcare and education and give practical force to the African Continental Free Trade Area. His message was unmistakable: Ubuntu must become an economic practice of sharing knowledge, markets and resources. The most concrete expression of that idea was the launch of KUMii by 22 On Sloane. An AI-powered ecosystem platform, KUMii is designed to connect entrepreneurs, investors, policymakers, mentors, professional service providers and ecosystem partners in one digital environment. Led by KUMii CEO Noma Ngubane, with Zinhle Kubheka and other ecosystem specialists, it seeks to connect businesses to capital, markets, knowledge, expertise, tools and opportunities. Its ambition is not to create another isolated portal, but to reduce the friction that leaves valuable programmes scattered, founders invisible and support providers working in silos. KUMii could become the connective tissue of Africa’s MSME economy.  The congress also confronted the investment gap. Sessions involving Priyansh Dhawan, Amina El Zayat of the International Finance Corporation, Nkosikhona Mbatha of SEDFA, Maxwell Gomera of UNDP and Oluwatoyin Ahmed Edu of Nigeria’s Bank of Industry examined how angel finance, venture capital, blended finance and stronger local funds can move enterprises beyond pilots. At the same time, Phuthi Mahanyele-Dabengwa of Naspers & Prosus and Emmanuel Lubanzadio, Africa Lead at OpenAI, explored how AI, data and skills can drive industrialisation rather than deepen exclusion. GEC+Africa’s vision is broad enough to include creative industries, renewable energy, township ventures, fintech, healthcare, food systems and cross-border trade. The “Made in Africa” conversation, featuring leaders such as Sylvester Chauke, Eyram Tawia and Zama Phakathi, affirmed that culture and storytelling are also engines of jobs, identity and global competitiveness. The Road to GEC+Africa pitch competitions, culminating in a continental showcase of 15 finalists, gave that vision an entrepreneurial face. Various sessions highlighted the role of venture capital in African MSME businesses, and noted that the angel investment ecosystem of the continent, which is just 20% of that of India, needs a major push forward before VC funding comes into play.  A session on the creative industries highlighted recent achievements of the sector noting that by 2030 the sector is expected to cross USD 200 billion in gross turnover. It did also note that AI is a cautious enabling factor in creativity in the continent, and a formal structured learning in this sector was still missing by and large in most African nations. The content creating and selling eco-system is still in its infancy and needs capital infusion, along with procedural, technological and policy-wise major push ahead.  The congress therefore matters beyond two days in Cape Town. Its real test will be whether conversations become partnerships, partnerships become pathways and pathways help ordinary African businesses scale. GEC+Africa has named the challenge. With KUMii, it has begun building the infrastructure to answer it. The YouthAid Entrepreneurs’ Federation of India is being represented here by the founder Mathew Mattam and Board Member Prof Ujjwal K Chowdhury (also the editor-in-chief of SustainVerse.org).  ...Read more

14 Sep 2026

India’s 7.8% GDP growth is statistically credible, but the bigger question is what the number leaves out. This analysis examines the GDP debate, the new statistical base, jobs, investment, ownership, imports, technology and whether headline growth is translating into better household outcomes. SummaryIndia’s Q1 FY2026–27 GDP growth of 7.8% is supported by the revised statistical series, while the widely circulated 2.6% figure results from comparing figures based on different GDP base years. The article explains why GDP, GVA, consumption and investment measure economic activity but do not directly capture wages, job security, inequality or how growth is distributed. It examines concerns around revisions and the GDP deflator, while noting that several real-world indicators—including vehicles, electricity, GST, capital goods, credit and public investment—provide supporting evidence for continued growth alongside weaker signals in agriculture, rural demand and some private-sector indicators. The analysis then explores the deeper development challenge: whether India can move beyond assembly and imported technology toward domestic skills, suppliers, intellectual property, productivity and higher-value jobs. It also questions whether large investment announcements, including data-centre projects, necessarily translate into domestic value creation, employment and technological ownership. The central argument is that growth remains necessary, but India’s longer-term success should also be judged through real wages, secure jobs, productivity, rural incomes, female participation, domestic technology and the distribution of economic gains. A magazine explainer for the thinking Indian citizen  Somewhere between a WhatsApp forward claiming India "faked" 7.8% growth and a government press release calling it a triumph, most Indians have quietly given up trying to understand their own economy's report card. That's a problem, because GDP arguments aren't abstract — they decide whether your child's first job is secure, whether the rupee buys less petrol next year, and whether "India growing" means you growing. This piece takes twenty-two of the sharpest questions Indians have been asking about the Q1 FY2026-27 GDP number — 7.8% real growth, a rival "2.6%" claim, a mysterious base-year change — and answers them one at a time, in plain language, with Indian examples and a look at how other countries have wrestled with the same demons: rebased economies, doctored statistics, jobless booms, and technology built at home but owned abroad. The one-line verdict up front: the 7.8% figure is a legitimate number from a recent (if badly communicated) statistical overhaul; the rival 2.6% figure is valid only for an earlier base. But both camps are arguing past the real question — not "did the economy grow?" but "who is the growth for, and who owns what it built?" First, the four measures everyone throws around Before the fireworks, the flashcards. Four numbers get quoted in every GDP story, and mixing them up is where half the confusion begins. GDP — Gross Domestic Product. The total market value of everything final that got produced in the country in a period. It answers: how big and how fast is the economy? GVA — Gross Value Added. What producers and sectors actually add, once you strip out the inputs they bought. If a Tiruppur garment unit sells ₹100 crore of clothes made from ₹60 crore of fabric and yarn, its GVA is ₹40 crore. GVA tells you which sectors are creating value — agriculture, manufacturing, services — and India's GDP and GVA growth rates can diverge because of taxes and subsidies sitting between the two. PFCE — Private Final Consumption Expenditure. What households actually spend — food, rent, school fees, phone bills, the works. It answers: how much are people consuming? It's the single largest slice of India's GDP, so a good PFCE print usually means a confident consumer — though inflation alone can inflate it too. GFCF — Gross Fixed Capital Formation. Money sunk into things that will keep producing for years: factories, machines, roads, software. It answers: how much is the economy investing in tomorrow? "Gross" means depreciation hasn't been subtracted yet, and it excludes financial punts like buying shares. None of these four numbers directly measures your salary, your job security, or how evenly the gains are shared. Keep that sentence in your back pocket — you'll need it by the end of this piece. What exactly are we even fighting about? Before deciding whether 7.8% is impressive or a scam, is this a dispute about economic activity, methodology, inflation adjustment, or outcomes? All four, but they don't deserve equal airtime. The much-shared 2.6% number is simply not a valid calculation — more on that in a moment. The genuine live argument is a technical one: do India's new price deflators measure real activity accurately? The bigger, more consequential argument is developmental: does this output turn into jobs, wages, private investment, and technology India actually owns? Treat arithmetic, measurement, and development as three separate courts, or you'll convict the wrong defendant. Round 1 — Doing the Maths Honestly "2.6% growth" — the viral number that isn't a number Is the claim that India grew only 2.6% based on a fair comparison? The 2.6% figure compares Q1 FY27 nominal GDP of ₹88.27 lakh crore, measured under India's new 2022-23-base series, against Q1 FY26 nominal GDP of ₹86.05 lakh crore measured under the old 2011-12-base series. That's like comparing your height measured in centimetres this year against your height measured in inches last year and calling the difference "growth." The valid comparison — new series against new series — is ₹88.27 lakh crore against a revised ₹80.00 lakh crore: 10.3% nominal growth and 7.8% real growth. The 2.6% figure is a useful red flag about how large the revision was; it is not an alternative official growth rate. Why can't figures from two different base-year series simply be combined? Because a base-year change resets sector weights, data sources, price indices and estimation methods all at once. Combining old-series and new-series numbers treats a statistical redesign as if it were real economic change — it's not a conservative estimate, it's an invalid ratio, full stop. Indian context: This isn't India's first base-year change — the country moved from a 2004-05 base to a 2011-12 base in 2015, and that revision also sparked confusion when it retrospectively lifted growth estimates for 2013-14. Base revisions are a recurring ritual in Indian GDP-watching, not a one-off scandal. Global comparison: Nigeria offers the most dramatic version of this confusion. When it rebased its GDP from a 1990 base year to a 2010 base year in April 2014, its estimated economy leapt by 89% overnight — instantly making it Africa's largest economy, ahead of South Africa. The updated figures did reflect genuinely under-measured sectors, like telecom and the Nollywood film industry, but they also sat alongside the country's real, unchanged problems — low fiscal revenue, weak job creation, persistent poverty. No Nigerian became 89% richer that morning — the ruler changed, not the country. India's much smaller revision provoked outsized panic partly because nobody drew that Nigerian-style picture for the public in plain language. Once you compare like-with-like, how much should we trust the 7.8%? Moderate confidence, not blind faith. The number is internally consistent — it's backed by 8.2% real GVA growth, 9.2% manufacturing growth, 10.0% services growth, 7.1% consumption growth (PFCE) and a strong 11.9% investment growth (GFCF). But it remains provisional and sensitive to the deflator (see Round 2), so transparency and independent replication still matter before anyone chisels it into stone. Has the debate confused nominal GDP, real GDP, and revisions? Yes, constantly. Nominal GDP is value at today's prices; real GDP strips out inflation to show volume; a revision changes the estimate of an earlier period using better data. A lower revised base can mathematically raise this year's growth rate without any manipulation — but the statistics office owes the public a clear explanation of exactly why the earlier number changed, not just a new number dropped without a bridge. Was India's real growth actually close to zero this quarter? Not as any defensible national-accounts estimate — that reading only survives if you deliberately compare mismatched series and then bolt on an assumed inflation adjustment. But here's the honest caveat: a household's felt growth can be close to zero even when the national number is genuinely 7.8%, if wages, job security, and purchasing power for that household haven't moved. That's a distributional judgment about who's benefiting, not a rival estimate of total output. Both things can be true at once — remember this, because it becomes the spine of the whole article. Round 2 — Why Last Year's GDP Suddenly Got Smaller Is a revision this size normal? Revisions are routine whenever base years, data sources, weights and deflators change — but a jump this large demands unusually clear communication, even though "unusual" doesn't mean "illegitimate." The entire historical series has to be rebuilt from scratch for old and new numbers to stay comparable. Does the new methodology genuinely improve accuracy? In principle, yes. It draws on broader administrative and enterprise data (GST filings, corporate ministry records, e-Vahan vehicle registrations), updated household surveys, over 300 price indicators, better informal-sector coverage, and "double deflation" in manufacturing (explained below). But "in principle better" is not the same as "proven better" — that requires the back series, source notes and replication files to be made public, which as of this writing they largely haven't been. Has the scale of revision, even if legitimate, created a trust problem? Yes — and this is where India's statisticians have genuinely fumbled the ball. The public first saw an ₹86.05 lakh crore figure, then a revised figure near ₹80 lakh crore, then a fresh ₹88.27 lakh crore figure — with no immediate, plain-language bridge explaining the jumps. Being technically correct doesn't erase a communication failure. Credibility needs a visible paper trail, not a black box. Global comparison — the cautionary tale: Argentina shows what happens when a statistics office loses that trust entirely. After its national statistics agency, INDEC, was politically overhauled in 2007, its officials were widely accused of tampering with inflation figures, and Argentina went on to become the first country the IMF ever formally censured for submitting inaccurate inflation and growth data. Independent economists ended up running their own private price-tracking websites just so ordinary Argentines had numbers they could trust — down to things as mundane as adjusting a divorce settlement for real inflation. India's MoSPI is nowhere near that credibility crisis, but the lesson stands: once citizens stop trusting the referee, no number — however honestly calculated — will be believed. India's fix is cheap by comparison: publish the revision ledger. Why did the new series make earlier years look smaller? Reweighted sectors, revised informal-sector estimates, new industrial and price data, different price treatments, and improved statistical-discrepancy adjustments can all lower a historical estimate. It means the ruler changed — not that the economy physically shrank in hindsight. What should MoSPI publish so outsiders can check its homework? A machine-readable comparable back series, a vintage-by-vintage revision ledger, sector weights, granular deflators, source-coverage notes for GST/MCA/PLFS/PFMS/e-Vahan data, and reconciliation tables — with independent review built into the release process itself, not bolted on after controversy erupts. Round 3 — The Deflator: India's Real Technical Fault Line This is the one genuinely wonky bit worth understanding, because it's where honest critics have their strongest point. Is a GDP deflator of around 2.3% believable right now? It's possible, because the GDP deflator prices a different, broader basket than retail inflation (CPI) or wholesale inflation (WPI) — but it looks unusually low next to both. That makes it a candidate for audit, not an automatic disproof of the growth number. The real test is whether the underlying output and input prices reflect actual transactions across sectors, not guesswork. Why shouldn't the GDP deflator track CPI or WPI anyway? CPI tracks what households buy at retail; WPI tracks wholesale goods. The GDP deflator is an implicit, economy-wide price measure covering investment, government services, exports and imports too — it can legitimately diverge from both. But a persistent, large gap needs an explanation, not a shrug. How does "double deflation" let real growth beat nominal growth? It deflates a sector's output prices and its input prices separately, instead of applying one blanket index to everything. If input costs (say, steel and energy for a factory) rise faster than what the factory can charge for its products, nominal value added gets squeezed even while the physical volume of goods produced keeps climbing. So real GVA can genuinely outpace nominal GVA — the arithmetic is sound, but its reliability rides entirely on how good the underlying price data is. Does double deflation make things more accurate, or more fragile? Both, honestly. It's more accurate when input and output prices are well measured, because it stops one broad index from being force-fitted onto unlike items. But it's also more sensitive — an error in either price series distorts the "residual" value added, so India needs granular, transparent price data to make this method trustworthy rather than a black box that quietly produces flattering numbers. Is 9.2% manufacturing growth real, or a methodology artefact? The wider evidence — corporate sales, electricity use, GST collections, capital-goods output — points to genuine industrial expansion. But the exact 9.2% figure, sitting alongside 7.7% nominal growth and an unusually low deflator, is a gap large enough to deserve item-level cross-checks against real-world indicators before being taken as gospel. Real growth with an uncertain precise magnitude is the honest verdict — not fraud, not full confidence either. Round 4 — Does the Rest of the Economy Back Up the Headline? What independent, real-world signals support 7.8%? Vehicle registrations, capital-goods production, cement and steel output, electricity consumption, bank credit growth, GST collections, corporate capex announcements, payroll additions, and a strong 12.0% real export growth all point the same direction. No single indicator is decisive, but together they make a "zero real growth" story implausible. What contradicts or complicates the story? Agriculture grew only 3.6%; mining actually contracted 2.4%. Rural demand, real wages, informal enterprises, private capex intentions, and some manufacturing-sentiment surveys remain patchy, and declining foreign investment plus currency pressure complicate any tidy "boom" narrative. These don't erase the growth — they narrow its width and question its quality. What's actually driving growth — consumption, government spending, investment, or exports? A mixed bag tilted toward public capital spending, formal services, and select manufacturing clusters, rather than one broad-based private investment wave. Consumption (PFCE) grew 7.1%, investment (GFCF) 11.9%, exports 12.0% — but whether private capex and rural demand can carry the baton is still the real test of durability. How broad-based is the boom across sectors, regions and incomes? Uneven, by design of the numbers themselves. Urban formal services, listed companies, and specific manufacturing clusters are running hot; agriculture, informal businesses and lower-income households are lagging. Premium consumption — SUVs, five-star weddings, iPhones — can surge even as mass-market purchasing power stays flat, producing what analysts call a K-shaped recovery: two diverging lines on the same chart, not one rising tide. Can GDP boom while ordinary households feel stuck? Yes, unavoidably. GDP measures total production, not median wages, job security, household debt, or how gains are shared. Employment can technically "rise" through gig work or casual labour even while secure, well-paid jobs stay scarce. Both a genuinely valid 7.8% output number and real public frustration can be true in the same country, in the same quarter. This is the crux the entire rest of this article now turns to. Round 5 — Rajan vs. Vembu: Two Diagnoses, One Patient Two of India's sharpest public voices — economist Raghuram Rajan and technology entrepreneur Girish Mathrubootham/Zoho's Sridhar Vembu — have been read as contradicting each other in recent months. They aren't. They're examining two different organs of the same patient. Are Rajan and Vembu really disagreeing? Not fundamentally. Rajan's question is: why isn't growth producing enough decent jobs, private investment, and human capital? Vembu's question is: why does India capture so little of the technology, intellectual property, and profit margin from the work actually done here? One diagnoses the employment outcome; the other diagnoses who owns the value chain. Complementary, not competing. Can low-paying assembly jobs become a ladder to something better, the way they did in East Asia? Yes — but only when assembly is deliberately used as a learning platform, not treated as the finished product. South Korea and Taiwan didn't stay content-to-assemble; they used early low-value assembly contracts to build domestic suppliers, engineering talent, export capability and eventually world-beating firms of their own (think Samsung's leap from assembling foreign electronics to designing its own chips, or TSMC becoming the company Apple and Nvidia depend on rather than the other way round). Without those deliberate conditions, assembly work becomes a permanent low-wage enclave — a treadmill, not a ladder. What makes an assembly ecosystem actually build local suppliers, skills and IP? Time-bound incentives tied to rising local content, supplier development, apprenticeships, R&D spending, domestic patents, export sophistication and productivity — with firms required to publish capability milestones and lose their support if they miss them. Support without a scoreboard just becomes permanent subsidy. How long should India accept lower wages while companies "climb the value chain"? Only as a clearly defined transition — never an open-ended promise. A five-to-ten-year support envelope, reviewed every three to five years, with subsidies tapering automatically if wages, skills, local suppliers and R&D fail to improve, is the discipline that separates genuine industrial policy from indefinite corporate welfare. Does India need millions of ordinary jobs, or fewer high-productivity ones? Both, simultaneously. India needs accessible jobs now for workers still moving out of low-productivity farming, and a parallel expansion of high-productivity careers in engineering, design, digital services and advanced manufacturing. Picking only one horn of this dilemma leaves the other problem — mass employment or national productivity — permanently unresolved. Can high-value services and startups alone create enough jobs? They can generate excellent, high-paying, export-earning employment — but not at the scale India needs. Roughly 11 million people are expected to enter India's workforce every year for the next two decades. Manufacturing, construction, logistics, tourism, and care work will have to carry much of that load; software unicorns cannot absorb a labour force that size on their own. What does a real career pathway from a ₹20,000 factory job actually look like? Apprenticeship → portable certification → process and quality training → promotion to technician or supervisor → movement into supplier engineering → eventually design or R&D roles. It requires employers who actually run engineering functions in India, continuous upskilling, basic social protection, and wages tied to measured productivity gains — not just tenure. Round 6 — Who Actually Owns the Value? This is the section every Indian techie, founder, and policymaker should read twice. Does hosting global R&D automatically mean India captures the value? No. Global Capability Centres (GCCs) in Bengaluru, Hyderabad and Pune generate real wages, local procurement, tax revenue, and genuine skill-building — all valuable — but the parent multinational typically retains the intellectual property, the licensing income, the platform rents, and the commercial profit, booked abroad. A GCC's headcount is not the same thing as ownership of the technology those employees built. How much of the value Indian engineers create shows up in India's GDP? There's no single reliable percentage — that's precisely the problem. Indian GDP captures wages, domestic profit, local inputs and taxes; the IP royalties, equity gains, and profits recognised in a parent company's home country are largely not counted as Indian value-added. Getting a precise number would need firm-level accounts and detailed supply-chain data that mostly don't exist publicly yet. Is comparing Indian headcount to a multinational's global profit meaningful? Too simplistic to use as an accounting argument, though the direction of the comparison is a fair provocation. Profit also depends on IP ownership, capital, risk-taking, transfer pricing, and global market control — not labour input alone. The asymmetry it illustrates is real; the specific ratio isn't rigorous. Does owning IP matter more than manufacturing volume for wages? For sustained wage growth, yes — ownership of scarce technology and commercial rights is usually more decisive than sheer manufacturing volume. High-volume assembly without design ownership or supplier power tends to keep both margins and wages anchored close to bare labour-cost competition. Global illustration: This is exactly the trap South Korea and Taiwan escaped and many other assembly-hub economies haven't. A country can host enormous manufacturing volume — think of the "world's factory" label applied at different times to Mexico's maquiladoras or Vietnam's electronics-assembly boom — without ever owning the brand, the chip design, or the software stack that captures the lion's share of the final retail price. What would encourage more India-owned, India-commercialised IP? R&D tax credits tied specifically to domestic patenting and commercialisation (not patent-filing alone), stronger university-industry technology transfer, patient deep-tech capital, government acting as an anchor customer for homegrown tech, and better standards, procurement and IP enforcement. Domestic champions, technology transfer, or MNC incentives — which does India need? All three at once. Domestic champions create genuine Indian ownership; better technology-transfer mechanisms build capability; predictable incentives can persuade multinationals to locate real decision-making and IP functions inside India rather than just assembly lines. No single lever closes this gap alone. Can India capture more value without scaring off the MNCs that employ Indian engineers? Yes — through predictable rules, strong IP protection, deep skilled talent, deep capital markets, and incentives for local R&D, rather than punitive restrictions. The goal is parallel ecosystem-building: keep attracting multinationals while simultaneously making Indian firms capable of owning, financing and commercialising their own technology. Round 7 — Does India Need a Sharper Industrial Policy? Is industrial policy necessary for a developing country to build technological capability? Usually, yes. Late developers face coordination failures — in skills, suppliers, finance, technology — that markets alone often can't solve fast enough. But industrial policy has to be disciplined, transparent and temporary; its job is to buy capability, not protect inefficiency forever. Is India's current industrial policy building competitive firms, or subsidising assembly? A mixed picture, with a genuine risk of subsidising assembly for its own sake — rewarding output volume more than R&D, local components, exports, or productivity gains. The real test isn't the size of the incentive announcement; it's whether domestic supplier depth, patents, engineering decision-making, wages, and export sophistication are actually rising over time. What separates good East Asian industrial policy from protectionism and cronyism? Successful programmes tied support to exports, productivity, local capability-building and technology learning; exposed firms to genuine competition; reviewed performance regularly; and withdrew support on a pre-announced schedule. Protectionism shelters firms without demanding results; cronyism picks beneficiaries without any public performance test at all. Should support require R&D, local IP, exports and productivity — not just production? Yes. Production should be an entry condition, not the finish line. Support should also demand R&D intensity, domestic patents, local suppliers, export complexity, worker training, rising productivity and wages, and energy efficiency. How long before an industry is expected to compete on its own? A pre-announced five-to-ten-year window, with milestone reviews every three to five years and automatic tapering — varying by sector, but with the discipline that missing capability milestones triggers withdrawal of support, not renewal through lobbying. Is India's real choice "become Mexico" or "become East Asia"? Too narrow a frame. India can combine labour-intensive manufacturing for mass jobs, high-value services for exports, digital public infrastructure (UPI, Aadhaar, ONDC) for productivity, and entrepreneurship for innovation — a genuinely hybrid Indian model rather than a copy of any single country's playbook. Round 8 — Growth, Imports, and the Rupee Can strong GDP growth coexist with pressure on the rupee and the current account? Yes, routinely. Catch-up growth raises demand for imported energy, machinery, semiconductors, software and capital goods. If imports outpace exports, the current account and the currency can come under pressure even while real GDP is growing rapidly — India has lived this cycle before, notably around 2012-13. Does faster growth deepen import dependence before domestic capability catches up? Yes, especially in data centres, semiconductors, renewable-energy hardware and advanced machinery. That's not automatically bad — productive imports can build future capacity — but it becomes a genuine risk if domestic suppliers, R&D and skills never scale up to replace them. How much domestic value does India actually retain from import-heavy exports? It varies too much by product for a single number to be honest. Domestic value is wages, local services, logistics, taxes and Indian profit; imported components and foreign-owned technology largely pass through with limited retention. India's supply-and-use tables should publish sector-specific domestic value-added shares rather than leaving this to guesswork. Is telling citizens to cut foreign travel, weddings abroad, and gold buying meaningful, or symbolic? Mostly symbolic at the macro scale — though not entirely irrelevant. The decisive foreign-exchange pressures come from energy, capital goods, and technology imports, not household discretionary spending. Policy shouldn't offload a structural, national-level responsibility onto individual moral appeals. Should the burden fall on households, or on energy and technology policy? Policy has to lead. Energy diversification, domestic capital-goods manufacturing, technology capability-building, export upgrading and stable trade rules matter far more than broad appeals asking households to tighten their belts. Targeted restraint can help at the margins — it cannot substitute for industrial and energy strategy. Which imports are wasteful, and which are investments in the future? Luxury consumption and non-essential gold generally add little productive capacity. Machinery, semiconductors, software, renewable-energy equipment and R&D tools may worsen the near-term trade balance but count as investment if they raise productivity, capability, or future exports. The test is future learning value, not the import label itself. How long before India's tech and energy import dependence meaningfully shrinks? Technology dependence is roughly a 10-to-15-year project if R&D, skills, and manufacturing scale up consistently. Energy dependence will likely take longer — 15 to 20 years — because it involves transport, storage, grids, and industrial fuel substitution all moving together. These are planning horizons, not guarantees. Round 9 — Big Investment Announcements vs. Real Transformation Are giant investment announcements being mistaken for actual value creation? Often, yes. An announcement is a commitment, not proof of money spent, domestic value added, jobs created, or technology transferred. Data centres may be strategically important, but their direct GDP and employment effects can be modest relative to the headline capex numbers splashed across newspapers. How much spending on a new data centre flows straight back out through imported GPUs, servers and cooling systems? A significant share can leak abroad, though the exact proportion depends entirely on project design and procurement choices. GPUs, servers, cooling and networking equipment are import-intensive, so the domestic value of the construction phase shouldn't be mistaken for the value of the entire investment. Real answers need project-level bills of materials, not press-release arithmetic. Can data centres still deliver big second-order benefits? Yes — through cloud services, home-grown AI companies, and digital exports — but only if Indian firms actually build products and services on top of that infrastructure. Without domestic platforms, skills, data governance and genuine customer demand, India risks hosting foreign digital workloads while retaining mainly construction, power, and facility-management jobs. What needs to be built around this infrastructure to capture more value? Domestic cloud and server capability, chip and component supply chains, reliable green power, AI and cybersecurity skills, data governance frameworks, compute credits for startups, public procurement support, and export channels. The goal is Indian firms owning the models, applications and customer relationships — not merely renting out imported compute. Should capital-heavy infrastructure be judged by different metrics than mass-employment sectors? Yes. Data centres deserve to be judged on strategic resilience, productivity spillovers, digital exports, energy use, and technology ownership. Textiles, food processing, tourism, and care work should be judged far more heavily on jobs created. A single "jobs-per-rupee" test would undervalue infrastructure investment; a single capex test would quietly hide weak employment outcomes. What separates "hosting compute" from building a genuine indigenous AI economy? An indigenous AI economy has Indian-owned models, datasets, applications, patents, firms and export revenues — built on top of domestic compute and talent. Simply hosting foreign hyperscalers' servers, without local ownership, builds infrastructure capacity while leaving the highest rents and strategic control sitting elsewhere. Round 10 — GDP vs. Lived Reality Can the 7.8% number be statistically sound while public frustration is equally legitimate? Yes. GDP measures the volume of production; it says nothing about median wages, job security, household debt, inequality, or public confidence. A valid national number and a genuinely weak household economy can coexist in the very same quarter, in the very same country. Has India put too much political weight on one single number? Yes. A quarterly GDP print has become an all-purpose proxy for national welfare, even though it was never designed to measure welfare in the first place. It deserves to sit as one indicator on a public dashboard — not stand as a verdict on every household's life. What indicators should accompany every GDP release? Employment, real wages, private investment, household consumption by income group, productivity, and per-capita income — alongside labour-force participation, female workforce participation, payrolls, vacancies, hours worked, rural incomes, private capex, external balance and emissions. Quantity of growth and quality of growth need to be reported together, every single quarter. Does the new series capture informal workers, gig workers and household enterprises properly? Better than the old series — through GST data, enterprise surveys, the Periodic Labour Force Survey, e-Vahan and other administrative sources — but still imperfectly. Informal and gig activity is often estimated indirectly, and small household enterprises can slip through the gaps between survey rounds. More frequent surveys and anonymised microdata would close this gap. What should "quality growth" mean for a country at India's stage of development? Rising productivity accompanied by rising real wages, secure and formalising jobs, stronger rural incomes, higher female workforce participation, domestic technology and IP ownership, export competitiveness, and resilience to energy and climate shocks. Growth has to widen opportunity — not just expand output inside a handful of capital-intensive enclaves. How do we stop legitimate scrutiny from collapsing into partisan denial of the whole economy? Separate technical adjudication from political theatre. Publish methods and revision ledgers, allow independent replication, clearly flag what remains provisional, and always read GDP alongside jobs, wages and investment data. Criticising a method should never be twisted into denying real economic activity; celebrating activity should never be used to silence legitimate scrutiny either. Closing Question — Measurement Problem, or Development Model Problem? Suppose the 7.8% figure is methodologically sound. If India keeps growing fast while staying dependent on imported energy and technology, capturing limited value from work done here, and struggling to create better-paying jobs — is that a measurement problem, or a development-model problem? And ten years from now, will it matter more how fast GDP grew, or how much technology, IP, productive capacity and prosperity India actually kept? Primarily a development-model problem, with a continuing measurement-and-credibility problem sitting at the margins. Accurate GDP growth can perfectly well coexist with weak value capture, import dependence, and poor job quality — India's own recent history is proof of concept. Ten years out, the decisive scoreboard won't be a quarterly growth print; it will be domestic IP, supplier depth, productive skills, real wages, energy resilience, and how broadly prosperity actually spread. The growth rate is necessary evidence of India's story. It is nowhere near sufficient evidence of India's development. A note on statistical honesty, for the record None of this is unique paranoia. For years, China's own provincial GDP figures, added together, ran higher than the national total the central government reported — a gap widely traced to local officials whose careers depended on flattering growth numbers, most visibly when Liaoning province's governor publicly admitted in 2017 that city and county officials there had fabricated growth and fiscal data for three straight years. India's episode is nowhere near that scale of deliberate fraud — this is a genuine base-year revision with a communication failure, not a cover-up. But the comparison is a useful reminder of what real data manipulation looks like, so citizens can tell the difference between a badly explained methodology and an actually rigged number. This explainer synthesises MoSPI's official Q1 FY2026-27 GDP release and base-year FAQ, RBI and World Bank commentary, and the public debate involving Raghuram Rajan, Sanjeev Sanyal, Subhash Garg, Arvind Subramanian and K.V. Subramanian, among others. All Q1 figures remain provisional pending revision. ...Read more

03 Sep 2026

From mega-dams and cut slopes to a resilient economy of rivers, forests and indigenous enterpriseSeptember 2026 Arunachal Pradesh faces a critical development choice as hydropower, roads and large infrastructure projects expand across a fragile Himalayan landscape. The article calls for a safer model built around resilient communities, local livelihoods and ecological limits. SummaryArunachal Pradesh’s rapid infrastructure development is bringing roads, hydropower and other projects into a landscape shaped by steep slopes, seismic activity, intense rainfall and growing climate risks. The article argues that development cannot be judged only by megawatts generated, kilometres of roads built or investment attracted, but also by safety, ecological impact and community well-being. It examines concerns around projects such as Upper Siang and Etalin, including displacement, forest diversion, biodiversity loss and the risks of building in vulnerable river basins. At the same time, it presents alternatives centred on community tourism, value-added agriculture, local energy systems and indigenous enterprise. The proposed approach places local communities, customary institutions and ecological resilience at the centre of development decisions. Ultimately, the article calls for an Arunachal model that delivers stronger livelihoods and public services without increasing long-term exposure to environmental and climate risks. THE PROPOSITIONArunachal Pradesh does not have to choose between poverty and peril. It has to choose whether its rivers, forests and cultures will be treated primarily as national inputs, or as the living capital of a safer, higher-value local economy. The glacier-and-rock collapse reported in Nepal, the warning from Sikkim and Arunachal's own contested hydropower trajectory make that choice urgent. The Himalayas do not announce a disaster only when a dam breaks. They announce it through a spring that disappears after a tunnel is drilled, a road that slips every monsoon, a river whose sediment no longer reaches downstream fields, a village whose consent is counted only after the map is final. Arunachal Pradesh is at the point where these signals have to become policy. The mountain is not an empty balance sheet The most important fact about Arunachal Pradesh is also the fact most development plans suppress: it is a young mountain system still being made. Steep slopes, fractured rock, intense monsoon rainfall, active faults, fragile soils and a changing cryosphere respond to every road cut, tunnel, quarry, reservoir, settlement and drainage alteration. The three Counterview articles place this reality beside the August 26, 2026 glacier-and-rock collapse reported along the Nepal-Tibet border. A high-mountain failure became a debris flow, flood, infrastructure destroyer and humanitarian crisis downstream. The trigger was geological and cryospheric; the scale of loss was shaped by what had been built in the path of risk. Climate change changed the structure of risk by weakening ice, destabilising slopes, altering rainfall and making old design assumptions unreliable. Arunachal shares the conditions that make the Nepal event a warning: high seismicity, steep river valleys, expanding glacial lakes, cloudbursts, landslides and difficult emergency access. It has also experienced its own cloudbursts, road failures and district isolations. A road celebrated at inauguration but not maintained through the monsoon is not durable connectivity. A dam that multiplies a debris surge is not automatically a resilience asset. The question, therefore, cannot remain: how quickly can Arunachal add megawatts, kilometres of road and concrete? It must become: developed for whom, with what exposure, and at what price to the families who will live on these slopes fifty years from now? When infrastructure becomes exposure For two decades, Arunachal's development story has been narrowed into a familiar template: large hydropower projects for the national grid, strategic roads across unstable terrain, tunnelling through mountains and the rapid conversion of rivers into infrastructure corridors. The needs are genuine - roads, hospitals, schools, communications, jobs, energy and border security. But genuine needs do not make every engineering response wise. Upper Siang and Etalin are the clearest tests of that wisdom. The proposed Siang Upper Multipurpose Project, often described as an approximately 11,000 MW project, and the 3,097 MW Etalin project in the Dibang basin sit in landscapes that are seismically active, biodiverse and socially sensitive. Their proponents may present national power, flood moderation or strategic value; critics see high-consequence exposure in valleys where evacuation, rescue and compensation would be extraordinarily difficult. Project-by-project clearance is not enough when the river basin is the real unit of impact. A dam, access road, transmission corridor, tunnel, quarry and downstream cascade operate as one system. Blasting disturbs slopes and springs; hill-cutting changes drainage; a landslide can block a river, send an impulse wave into a reservoir or sever a village road. A GLOF or debris flow can breach a large structure and magnify the downstream disaster. Tofu-dreg infrastructure - built too quickly or cheaply for its setting - is a governance warning. The ecological bill is equally serious. Reservoirs submerge forests, fragment habitat, trap sediment and alter fisheries, riverine agriculture and downstream geomorphology. High-head barriers obstruct migratory fish; decaying biomass can release greenhouse gases. A centralised plant is also a single point of failure: if its powerhouse, transmission line or bridge is cut, the distant grid and the local community may lose power together. Sikkim offers a caution that Arunachal should not dismiss. The third Counterview article notes that the National Remote Sensing Centre assessed a 42 per cent probability of a South Lhonak Lake breach in 2013. On October 3-4, 2023, the lake breached; the Teesta III dam at Chungthang was destroyed, 55 people died, 74 went missing, more than 7,000 people from 1,756 families lost their homes, and thousands of houses were damaged across Sikkim. The reported proposal to rebuild at the same location, with a structure almost twice as high, illustrates the danger of treating a known risk as a reason for taller concrete rather than better land-use decisions. The missing people in the numbers The Upper Siang debate reveals why displacement cannot be reduced to a compensation spreadsheet. Project-side accounts cited in the dossier speak of around 16 villages and roughly 10,000 people directly affected. Community organisations and researchers speak of at least 27 villages, a 40-300 village impact zone and more than 150,000 people, depending on whether farmland, forest access, fisheries, grazing, sacred sites and downstream livelihoods count. The disagreement asks who is visible to the state. For the Adi people, the Siang is not an empty channel with a calculable flow. Ane Siang, the Mother Siang, is a cultural and ecological relationship. A village contains homes, terraces, orchards, fishing grounds, mithun routes, burial places, ritual spaces, memories and kinship networks. A resettlement colony can reproduce houses, not a river's meaning or the social geography through which knowledge travels. Compensation cannot restore a place-based civilisation. Etalin presents a smaller numerical footprint with the same principle. Project documents cited in the dossier indicate about 265 families in eight affected villages, with around 95 families facing involuntary displacement, while the project requires diversion of roughly 1,175 hectares of forest land. The project's environmental clearance has also faced legal challenge. Whether one supports or opposes the project, the lesson is clear: the burden of proof must rise when the cost is irreversible. Indigenous resistance to Upper Siang and Etalin is not an obstacle that publicity can remove. Adi institutions, farmers' forums, youth groups and human-rights advocates question consent, cultural survival, safety and benefit-sharing. Some affected families and village groups support the projects for expected flood protection or economic opportunity. That diversity makes independent deliberation essential. A signature after the design is fixed is not free, prior and informed consent. WHAT THE UPPER SIANG NUMBERS REVEALOfficial or project-side accounts cited in the dossier: about 16 villages and roughly 10,000 people directly affected. Community and civil-society accounts: at least 27 villages, a wider 40-300 village impact zone and more than 150,000 people. The gap is not a licence to choose the largest figure; it is evidence that the definition of 'affected' must include land, forests, rivers, culture and downstream livelihoods. A moratorium is a responsibility, not a rejection of development Arunachal should declare a time-bound moratorium on new large storage dams and high-risk cascades in the most vulnerable basins. This would create space for independent, cumulative assessments that model earthquakes, GLOFs, landslide impulse waves, sediment, extreme rainfall, upstream operations and failure of roads and communications together. The state needs a public hazard atlas. No-go zones should cover the highest landslide and GLOF susceptibility areas, irreplaceable biodiversity corridors and sites where evacuation is implausible. Low-no zones should permit only light, reversible or strictly conditioned activity. Settlements and critical assets already at risk need voluntary relocation or retrofitting, with land, services, transport and livelihoods planned together. Early warning is a social system, not a dashboard. Satellite and AI tools, weather radar, rain gauges, glacial-lake sensors, river gauges and slope monitors matter only if a village receives a clear alert, knows the safe route and practises the drill. Data-sharing across the India-Bhutan-China-Nepal Himalayan arc should be pursued wherever diplomacy allows. Roads and bridges should follow mountain behaviour: drainage first, slope bioengineering, vegetation reinforcement, controlled spoil disposal, spring protection, geotechnical inspection and dedicated maintenance. Vetiver, alder, bamboo and hydroseeding should complement engineering. The most strategic road may be the one that remains open and repairable, not the widest on inauguration day. Quality of life is the unit of progress A safer development model must answer everyday questions: can a child study during a monsoon outage, can a pregnant woman reach care, can a farmer sell without distress, can an elder remain in a familiar community, can a young person earn without leaving, and can a family sleep without fearing the next slope failure? These are the real measures of resilience. A safe home is infrastructure: Retrofit vulnerable homes and support voluntary, culturally appropriate relocation from the highest-risk zones. Promote earthquake-resilient construction using bamboo, cane, timber and local design knowledge wherever technically suitable.A reachable service is development: Combine district hospitals with telemedicine, mobile health units, emergency transport protocols and digital classrooms, so people need not be concentrated in unsafe places simply to reach a service.A maintained road is better than a grand road: Use geotechnical routing, drainage, bioengineering and slope monitoring. Limit widening, protect springs and accept seasonal or low-capacity routes where necessary. Budget maintenance as a core asset, not a post-disaster appeal.Local energy is strategic energy: Combine safe micro-hydro, rooftop solar, storage and islandable microgrids so border villages, schools, clinics, communication nodes and emergency centres remain powered when landslides cut the main line.  Tourism that pays the village The alternative to mega-project dependence is an economy that earns more from each unit of landscape without consuming it. Tourism can be a pillar, but Arunachal should avoid the familiar sequence in which roads arrive, hotels multiply, waste and water stress follow, and the host community receives the least value. Build high-value, low-density tourism around certified homestay clusters and community lodges regulated by village institutions or Kebangs. Publish carrying-capacity studies before scaling visitors, and use permits, seasonal quotas and route zoning for high-altitude lakes, glacial passes, sacred sites and wildlife corridors. Access must fit slope stability, water availability, cultural dignity and emergency capacity. The product should be experiential: Eaglenest birding, alpine botany, high-altitude treks, monastery and living-heritage circuits in Tawang and West Kameng, cultural and culinary immersion, river interpretation, farm stays, harvests and festivals. Tawang, Ziro, Mechuka, Namdapha and Pasighat can develop distinct identities. Kaimoi's Best Tourism Village recognition and work in Namsai show that cultural revival can be an economic asset. Room revenue, guide fees, permits, conservation fees and craft sales should flow to village committees and households. Cooks, drivers, porters, performers, farmers and artisans should be named beneficiaries. Training should cover hospitality, first aid, rescue, waste, digital booking, language and storytelling. Homestays need water, sanitation, fire, waste and structural standards without being forced to imitate urban hotels. The Lower Subansiri pondage proposal - a controlled tourism, adventure, cultural and inland-fisheries hub - deserves a transparent feasibility test. Reusing an altered site may be preferable to opening new upstream valleys, if safety, carrying capacity, fish ecology and community ownership are secured. Tourism must be a conservation contract: visitors receive meaning, communities receive income and ecosystems receive limits. Agriculture must leave as a product, not a truckload Agriculture should not leave Arunachal only as a truckload of unprocessed produce. Its microclimates can support a premium basket of kiwi, mandarin oranges, pineapple, apples, persimmon, walnuts, large cardamom, ginger, turmeric, chillies, buckthorn, medicinal plants, millets, Khamti rice, yak churpi and distinctive beverages. APEDA's buyer-seller work at Tawang points toward FPOs, FPCs, women's Self-Help Groups, branding, exports and value addition. The missing layer is a distributed system that lets farmers retain more value. Each producing cluster should have small solar-powered processing and packing capacity: grading, pulping, juicing, drying, pickling, fermentation, spice processing, safe packaging and traceability. Five- to ten-tonne community cold rooms can prevent distress sales when landslides block roads. A brand such as Arunachal Organic Himalaya can sit above district and tribal brands only if certification, quality control and producer ownership are real. Geographical indications should protect and premiumise distinctive products, not merely decorate packaging. Farmer Producer Companies should negotiate directly with urban retailers, hotels, institutions and exporters. Digital catalogues can show harvest windows, volumes and quality; public procurement can place local produce in schools, hospitals and tourism kitchens. Finance must cover working capital, cold chains and packaging. Women-led processing, food entrepreneurship and local logistics can create jobs without forcing young people to leave. Climate-smart agriculture should strengthen, not erase, local knowledge. Jhum should not be eliminated by decree; improved fallows, contour planting, water harvesting, agroforestry and community fire management can reduce erosion while preserving food cultures. Nitrogen-fixing alder, Alnus nepalensis, can be integrated with heirloom tea and black pepper. Success is a productive hillside that keeps soil, water, biodiversity and income together. Healing landscapes, not resort landscapes Arunachal's forests, clean air, hot springs, highland climates and spiritual traditions can support a careful nature-wellness economy. This is not a licence for large resorts. It is an invitation to design small, regulated experiences: forest-bathing or Shinrin-yoku trails, meditation retreats, monastery stays, nature-therapy walks, restorative food and hot-spring facilities with strict water and waste limits. Guides should be trained in ecology, mental-health first response, visitor safety and the limits of therapeutic claims. Indigenous dietary, herbal and healing knowledge must be documented with consent and benefit-sharing. Cooperative processing of managed non-timber products such as Mishmi teeta, wild turmeric or Taxus-related resources must prevent overharvesting and bio-piracy. Wellness should complement, never replace, public healthcare. Craft and local design as a living economy The cultural economy should be a productive sector, not an annual festival display. Apatani, Adi, Nyishi, Monpa and other weaving traditions; bamboo, cane and beadwork; Monpa paper; thangka and Buddhist art; and Wancho wood carving carry design intelligence. The challenge is repeatable income without flattening distinct identities into one generic Northeast aesthetic. District craft and design hubs can provide shared tools, natural-dye research, photography, packaging, e-commerce, accounting and market access. Partnerships with design institutes, fashion labels, architects and responsible retailers must protect attribution, intellectual property, fair prices and artisan control. A digital maker passport can connect each product to its maker, village, technique and material story; tourism circuits can add demonstrations, workshops and direct sales. Bamboo and cane bridge heritage with climate resilience. Bamboo anchors soil and can support homeware, furniture, structural alternatives and earthquake-conscious vernacular housing when engineered properly. Documentation and apprenticeships are vital: if craft is poorly paid, the state loses both a livelihood and an irreplaceable knowledge archive. A VILLAGE POWER TEMPLATEIllustrative 500 kW community-owned run-of-the-river model: 800-1,200 households and local institutions served; about Rs 4.5-5.5 crore capital cost; roughly 2.6 million kWh annually at 60 per cent capacity factor; customary council as trustee; Village Energy Management Society with women and youth representation; 35 per cent of revenue for O&M, 25 per cent for debt and 40 per cent for capital reserve, social dividend and watershed protection. Final feasibility, tariff and safety decisions must remain site-specific. Power where people live Arunachal's energy security does not require every river to become a gigawatt corridor. Safe run-of-the-river micro-hydro units, generally 10 kW to 2 MW, combined with solar and storage, can provide power close to where people live. Lower head, negligible storage and small civil footprints can reduce the scale of failure compared with a large reservoir, while allowing community ownership. No micro-hydro site is automatically safe; every site needs hydrology and geotechnical review. An illustrative 500 kW community-owned project could serve 800 to 1,200 households, schools, clinics and micro-enterprises. The dossier models a capital cost of Rs 4.5-5.5 crore and, at a 60 per cent capacity factor, around 2.6 million kWh a year. A customary council - Kebang, Tsumok or equivalent - can hold the land and water-use trust. A Village Energy Management Society can run the plant, with elders, a technical representative, local youth technicians and at least 50 per cent women and youth representation. Local operators should flush abrasive silt traps during the monsoon; four village youths can become primary and apprentice 'barefoot engineers'; the turbine maker can provide an annual maintenance contract; and prepaid smart metering can remove billing friction. A workable financing stack could blend 60 per cent public subsidy, 20 per cent CSR or green-climate finance, 15 per cent concessional debt and 5 per cent community land and labour. Tariffs can protect dignity and reliability: a lifeline domestic rate, a higher commercial rate for homestays and processing, and a regulated feed-in price for surplus. The illustrative revenue waterfall allocates 35 per cent to O&M, 25 per cent to debt service and 40 per cent to resilience - 15 per cent capital reserve, 15 per cent village social dividend and 10 per cent catchment protection. Energy then runs dryers, kiwi sorting lines, grain mills, five- to ten-tonne cold rooms and local EV charging hubs. The ten decisions that can change Arunachal's trajectory The state government can turn the argument into a social contract through ten decisions over the next 24 months. The sequence matters: first reduce irreversible exposure, then build the institutions and markets that make safer livelihoods credible. Pause new large storage dams and high-risk cascades while independent basin studies examine seismicity, GLOFs, landslides, sediment, climate projections and dam-break cascades.Create a public hazard atlas with no-go and low-no zones for heavy infrastructure, biodiversity corridors and high-risk settlements.Install real-time glacier, lake, rainfall, river and slope sensors in districts including Tawang, Dibang Valley and Anjaw, linked to village sirens, drills and last-mile communication.Make cumulative impact assessment and public disclosure mandatory for roads, tunnels, quarries, transmission lines and hydropower.Create a permanent Mountain Maintenance and Resilience Fund for drainage, bioengineering, bridge inspection, road restoration, emergency stocks and local responders.Launch district missions for community tourism, organic value chains, craft, design and nature wellness, with low-interest finance, procurement and ecological standards.Give FPOs, FPCs, women's SHGs, artisan guilds and tourism committees direct access to markets, digital systems, training and working capital.Adopt an enforceable FPIC-like protocol: disclose alternatives, recognise customary institutions, record dissent and share risks and benefits before decisions are final.Build decentralised energy around safe micro-hydro, solar, storage and islandable microgrids, with community, women and youth governance.Measure progress through disaster losses, forest cover, water quality, green-sector income, youth retention, service access and community satisfaction alongside GDP and capacity.  A future measured in more life per unit of concrete Arunachal does not face a binary choice between dams and poverty. It faces two theories of development. One treats the state as a resource warehouse whose rivers are exported, slopes cut faster than they heal and people compensated after decisions. The other treats mountains as the foundation of a local economy: forests that protect water, rivers that sustain culture and fisheries, farms that earn through processing, villages that host visitors on their terms, crafts that carry identity and energy systems that keep communities resilient. National security is not weakened by this second theory. A village with safe housing, a clinic, a digital classroom, a community microgrid, trained responders, maintained roads and dignified livelihoods is stronger than a landscape tied to one vulnerable transmission corridor. Ecological protection and strategic presence can reinforce each other when people are custodians and partners. The Nepal disaster, the Sikkim precedent and Arunachal's monsoon failures are not prophecies. They are choices made visible in advance. The government can still pause, listen, map, maintain and diversify. The goal is more safety, income, health, culture and possibility with less ecological damage. In a fragile Himalaya, that is the only progress that can endure.  Sources and editorial note Wangchuk Tsering. Safety first: Why reconsider hydropower in fragile Arunachal. Read online Neha Desai. Why the Nepal disaster is a warning Arunachal Pradesh cannot ignore. Read online Raj Kumar Sinha. Rising climate risks demand a new Himalayan development model. Read online APEDA / Press Information Bureau. APEDA and Government of Arunachal Pradesh host International Conclave cum Buyer-Seller Meet at Tawang. Read online APEDA. Arunachal Pradesh: GI and agricultural products profile. Read online Shiv Nadar University, Centre of Excellence for Himalayan Studies. Dams in the discourse of development: vulnerabilities and systematic barriers to communities-inclusive policies in Arunachal. Read online ...Read more

31 Aug 2026

Kolkata |31 August, 2026 India’s construction boom is creating a narrow window to cut emissions before new commercial and residential buildings lock in decades of energy demand. Green standards, low-carbon materials, efficient cooling and occupant wellness are becoming central to that transition. Summary India’s building sector is expanding rapidly, making construction and building operations an important part of the country’s decarbonisation challenge. Buildings already account for a significant share of India’s electricity demand, while much of the building stock that will exist in the coming decades is yet to be constructed. Green-building frameworks such as IGBC and GRIHA are pushing developers towards better energy, water, material and indoor-environment performance. BEE has also strengthened the policy framework through the Energy Conservation and Sustainable Building Code 2024 and Eco Niwas Samhita 2024. But certification alone cannot prove that a building is genuinely low-carbon. The bigger test is whether developers reduce embodied carbon in materials, improve HVAC performance, lower actual energy use and deliver measurable benefits for occupants after the building becomes operational. Can India’s real-estate boom become a decarbonisation opportunity instead of an emissions trap?India is entering a major phase of construction, with new offices, homes, hotels, hospitals and commercial developments expanding across its cities. Every building project makes decisions that can shape energy demand, cooling needs, material use and water consumption for decades. That creates both a challenge and an opportunity. A poorly designed building can lock in high energy consumption long after construction is complete. A well-designed one can reduce that demand from the outset through passive design, energy-efficient systems, lower-carbon materials and renewable energy. This is why the net-zero real-estate conversation is moving beyond visible measures such as solar panels and efficient lighting. The bigger question is how a building is designed, what materials go into it, how efficiently it operates and whether the people inside it actually experience healthier and more comfortable conditions. In other words, decarbonising real estate is not just about making buildings consume less electricity. It is about reducing their environmental footprint from construction and material choices through everyday operation and occupant wellbeing.   WHERE A BUILDING’S CARBON COMES FROM CONSTRUCTION Cement + steel + glass + transport↓ EMBODIED CARBON OPERATION Electricity + cooling + lighting + equipment↓ OPERATIONAL CARBON OCCUPANCY Thermal comfort + daylight + ventilation + indoor air quality↓ OCCUPANT WELLNESS NET-ZERO BUILDING Materials + energy + people + performance   Are green-building certifications enough to prove that a building is genuinely sustainable?India has developed two major voluntary green-building frameworks: the Indian Green Building Council (IGBC) and the GRIHA Council. Both assess buildings against a range of sustainability criteria, although their rating systems and approaches are not identical. IGBC offers rating systems for areas including new buildings, homes and net-zero buildings, while GRIHA evaluates factors such as energy and water use, materials, waste management, site planning and occupant-related performance. But certification should not be treated as simply a green label. It can demonstrate that a project has met a defined set of sustainability criteria. The harder test comes after the building is occupied.Does it perform as promised when it is put to real-world use?A developer may secure certification during the design or construction stage, but the building's real energy and resource performance becomes clearer only after it begins operating. Actual occupancy, cooling demand, equipment use and maintenance can all affect its performance. That makes the evidence behind the claim just as important as the certification itself. A credible assessment should establish the baseline, the performance target, the methodology used and the comparison point. It should also show how much energy the building actually consumes per square metre and whether that performance continues to be monitored after certification. This distinction becomes even more important for net-zero claims. A building may perform efficiently during operation, but its overall environmental footprint also depends on factors such as the materials used in construction and the emissions associated with producing and transporting them. Certification can show that a building meets a standard. Long-term performance data is what shows whether that standard translates into real-world sustainability.Can green cement and recycled steel cut the carbon hidden inside construction? Operational energy is only one part of a building’s carbon footprint. A building may use relatively little electricity once it is occupied and still carry significant emissions from the materials used to construct it. Those emissions are generated before the building is even ready for use, through activities such as mining, processing, manufacturing and transportation. This is why cement and steel are at the centre of the embodied-carbon debate. Developers and material manufacturers are increasingly exploring lower-carbon cement, alternative binders, recycled steel and more efficient use of construction materials to reduce emissions at this stage. But calling a material “green” is not enough. The real test is what changed compared with the conventional alternative. What material was replaced? What was its original carbon intensity? How much recycled content was actually used? Where was the material sourced from? What lifecycle boundary was used to calculate the reduction? And how much carbon was genuinely avoided? Without a clear baseline and reporting methodology, a percentage reduction can sound impressive while providing little information about its actual environmental impact. For a credible net-zero building claim, material-level emissions need to be traceable across the project's defined reporting boundary - from sourcing and manufacturing through construction and, where relevant, the building's future lifecycle. The goal is not simply to use greener materials. It is to prove how much carbon those choices actually prevent from entering the atmosphere.  THE EMBODIED-CARBON CHECKCONVENTIONAL MATERIAL Cement / steel↓BASELINE CARBON LOWER-CARBON MATERIAL Green cement / recycled steel↓ACTUAL CARBON ↓ MEASURED MATERIAL SAVING Baseline − Actual = Reduction Add: recycled content + source + lifecycle boundary + quantity used   Could HVAC design become the biggest operational test for green buildings?For India, cooling cannot be treated as an afterthought. As temperatures rise and air-conditioning becomes increasingly important across offices, homes, hospitals and commercial buildings, the way a building manages heat can have a major impact on both energy use and emissions. The Bureau of Energy Efficiency (BEE) building-efficiency framework covers areas including mechanical systems, HVAC, building envelopes, lighting, electrical systems and renewable energy. The Eco Niwas Samhita 2024 also focuses on residential building-envelope performance, with measures aimed at reducing heat gain while improving natural ventilation and daylighting. The logic is simple: a building that absorbs more heat needs more cooling, more cooling requires more electricity, and where electricity remains carbon-intensive, higher demand can mean higher operating emissions. That is why efficient HVAC systems cannot work in isolation. They need to be combined with insulation, shading, appropriate glazing, building orientation, ventilation and better envelope design. The more important question is therefore not simply: How efficient is the air-conditioner? It is: Why does the building need so much cooling in the first place?Building codes also play a crucial role. BEE's energy-efficiency standards provide a national framework, while state urban-development departments and local building authorities influence approvals, enforcement and implementation. MoHUA's urban-building policy framework and local development rules can further determine how sustainability requirements are translated into actual projects. This creates a potential implementation gap. A strong national standard can deliver limited results if compliance and enforcement remain weak at the city or project level.Does a green building still work if its occupants are uncomfortable?  This is where the human side of green construction becomes impossible to ignore. A building may report lower energy consumption while its occupants continue to experience excessive heat, poor ventilation, glare, noise or indoor-air-quality problems. Lower energy use alone therefore cannot determine whether a building is genuinely performing well. Occupant wellness needs to be treated as an outcome, not an optional feature added to a sustainability checklist. For offices, hotels, hospitals and residential buildings, relevant indicators can include: Thermal comfortIndoor air qualityDaylight accessVentilationAcoustic comfortOccupant satisfactionAccess to natural light and outdoor spaces The evidence should come from the people using the building as well as from its building-management systems. A developer's sustainability report can show energy consumption and technical performance. Occupant surveys can reveal whether those improvements actually translate into a building that is comfortable, healthy and functional for the people inside it. A building cannot be considered truly green if it saves energy on paper but compromises the people who have to live or work inside it. THE GREEN-BUILDING SCORECARD  AreaWhat should be measured?EnergykWh/m²/yearCarbonAbsolute + intensity emissionsMaterialsEmbodied carbonCementCarbon intensity + alternativesSteelRecycled content + lifecycle impactHVACEnergy performance + cooling demandWaterConsumption + reuseOccupantsComfort + air quality + satisfactionCertificationRating + post-occupancy performanceInvestmentBudget/capex + actual spendingContinuityPerformance after handover   Is India's building policy moving fast enough to match the construction boom?India already has a growing policy framework aimed at improving building efficiency and sustainability. The Energy Conservation and Sustainable Building Code 2024 and Eco Niwas Samhita 2024 provide updated approaches to energy performance and sustainable building design, while BEE also operates a voluntary star-rating programme for commercial buildings based on their actual energy performance. But a standard has value only when it moves from policy documents into real buildings. That means looking beyond whether developers have adopted a requirement on paper and examining whether it is followed through design, construction and everyday operation. State urban-development departments, municipal corporations and local building authorities also have an important role in approvals, development rules, implementation and enforcement, particularly where voluntary green-building standards overlap with mandatory regulations. The evidence should therefore separate five very different milestones: a target announced, a design approved, a certification obtained, a building completed and a building actually performing as promised. These milestones are not interchangeable, and treating them as one can make a project appear further ahead than it really is.What happens when green buildings cost more upfront? Cost remains one of the strongest arguments against more aggressive green-building requirements. Energy-efficient building envelopes, advanced HVAC systems, lower-carbon materials, smart controls and renewable-energy installations can all require greater upfront investment. That can encourage developers to prioritise measures with faster financial returns. But the calculation looks different when a building is assessed across its full operating life. Higher initial investment can potentially reduce electricity consumption, cooling requirements and maintenance costs over time. The better question is therefore not simply how much a green building costs to construct, but what environmental and financial outcomes that additional investment produces? A credible assessment should ask: How much additional capital expenditure was required? How much energy was saved? How much did annual operating costs fall? What was the payback period? And did the building continue to deliver those savings after handover? The money itself also needs to be traceable. A large sustainability commitment announced in an annual report is not the same as money actually spent on a completed project.Can India's developers move from green certification to genuine net-zero performance?Ultimately, the answer will depend on what the sector chooses to measure and disclose. The strongest projects will not stop at reporting the number of green-certified buildings. They will show baseline energy use, actual energy intensity, embodied-carbon calculations, renewable-energy generation, water consumption, occupant outcomes, capital expenditure and post-occupancy performance. The comparison point matters just as much. A claim that a building uses 30% less energy may sound significant, but 30% less than what? Was it compared with a conventional code-compliant building? An earlier version of the same project? Or a comparable building operating in the same climate? Without a credible baseline, even a large percentage reduction can be difficult to interpret. Net-zero performance is ultimately about measurable change, not simply the presence of a green label or the size of a sustainability claim.   ANNOUNCEMENT VS OUTCOME GREEN TARGET ANNOUNCED ↓ DESIGN ↓ CONSTRUCTION ↓ CERTIFICATION ↓ OCCUPANCY ↓ ACTUAL PERFORMANCE Energy ↓ | Carbon ↓ | Cooling demand ↓ | Water ↓ | Comfort ↑ The real green-building story begins after the ribbon-cutting.   So, can India's real estate sector decarbonise before the grid does?It can reduce a significant part of the demand it places on the grid. But “net-zero” requires more than efficient equipment or a green certification. It requires a clear boundary around emissions, credible assumptions, measurable reductions and transparency about renewable energy and any offset reliance. The first priority should be reducing demand. That means designing buildings that need less cooling, using efficient systems, reducing material emissions and improving water and resource efficiency. Renewable energy can then address part of the remaining electricity demand. Offsets, where used, should be clearly separated from actual emissions reductions. The strongest net-zero building is therefore not the one with the most impressive sustainability label. It is the one that can show what its baseline was, what changed, how much it cost, what occupants experienced and whether the performance continued after the project was completed. THE REAL NET-ZERO BUILDING TEST Build less carbon into the structure.Use less energy to operate it.Cool it intelligently.Measure what occupants experience.Follow the money.Report actual performance.Keep measuring after certification. India's construction boom is creating a narrow window. What gets built today will shape the country's energy demand for decades. The question is no longer whether India can build greener buildings. It is whether it can prove that those buildings stay green once people move in.   Sources:  Bureau of Energy Efficiency (BEE) — Energy Conservation and Sustainable Building Code 2024 (ECSBC 2024)Useful for: commercial/office building energy-efficiency requirements, building envelope, HVAC, lighting, electrical systems and sustainable-building provisions. BEE — ECSBC 2024 BEE — Eco-Niwas Samhita 2024Useful for: residential building energy performance, building-envelope requirements, heat gains, daylight and natural ventilation. BEE lists the 2024 ENS among its current building-efficiency resources. BEE — Eco-Niwas Samhita 2024 BEE — Building Energy Efficiency / Energy Efficiency ResourcesUseful for: India's building-sector energy-efficiency framework, commercial-building performance and retrofit/cooling resources. BEE — Building Energy Efficiency Resources Indian Green Building Council (IGBC) — Green New Buildings Rating SystemUseful for: IGBC certification, energy efficiency, water conservation, building materials, indoor environmental quality, certification levels and the transition to Version 4.0 from May 2026. IGBC — Green New Buildings IGBC — Net Zero Carbon RatingThis is especially important for your article. It supports the distinction between design/construction-stage and operations-stage certification, embodied-carbon requirements and operational-carbon requirements. It also states that the certification is valid for three years, reinforcing your argument that performance needs to be monitored rather than treated as a permanent achievement. IGBC — Net Zero Carbon Rating IGBC — Green Existing Buildings Rating SystemUseful for: operational performance, mandatory energy/water/fresh-air requirements, certification review and the importance of final documentation rather than relying only on anticipated performance. IGBC — Green Existing Buildings IGBC — Green Homes Rating SystemUseful for: the residential side of your story and current Green Homes Version 3.0 framework. IGBC — Green Homes ...Read more

01 Aug 2026

India's growing vehicle scrappage ecosystem is transforming end-of-life vehicles into valuable resources, but the success of a circular material economy will depend on formal recycling, stronger infrastructure and public participation  Kolkata | August 1, 2026:Every vehicle eventually reaches the end of its useful life. The real question is what happens next. For years, old and damaged vehicles in India were largely dismantled in informal scrapyards, where valuable materials were recovered with little environmental oversight or scientific waste management.  Today, that approach is gradually giving way to a more organised system. As India expands its vehicle scrappage programme and establishes authorised recycling facilities, end-of-life vehicles (ELVs) are beginning to play a much larger role in the country's transition towards a circular economy. The shift comes at an important moment. India is one of the world's largest automobile markets, and millions of vehicles are expected to retire from the roads over the next decade. Managing this growing volume is no longer just about disposing of ageing vehicles. It is becoming an opportunity to recover valuable resources, reduce industrial waste and strengthen sustainable manufacturing. Under the government's Vehicle Scrappage Policy, ageing and unfit vehicles are encouraged and in certain cases required- to undergo fitness assessments before being transferred to Registered Vehicle Scrapping Facilities (RVSFs). These authorised centres are designed to dismantle vehicles scientifically, safely handle hazardous components and recover reusable materials such as steel, aluminium, copper, plastics, and rubber. Experts believe this approach could significantly improve India's resource efficiency. Recovering metals from scrapped vehicles requires far less energy than extracting and processing newly mined raw materials, helping reduce both production costs and carbon emissions.Recycled steel and aluminium are also expected to become increasingly valuable as demand continues to grow across the automotive, construction and infrastructure sectors.Yet building an efficient circular material chain remains a complex task. A substantial portion of vehicle dismantling is still carried out by the informal sector, which has supported recycling activities for decades through well-established local networks. While these businesses recover a significant amount of recyclable material, environmental safeguards, worker safety standards and material traceability often remain inadequate. Integrating informal operators into a regulated recycling ecosystem is therefore seen as one of the biggest challenges facing the sector. Infrastructure presents another hurdle. Expanding the number of authorised scrapping facilities is only part of the solution. Experts say the wider ecosystem-including testing centres, dismantling capacity and supporting infrastructure- still falls short in many parts of the country.The transition also faces another obstacle: participation. Public awareness of the scrappage policy remains limited, while logistical constraints and uneven implementation across states continue to slow the growth of formal recycling systems. Experts believe that without meaningful economic incentives, encouraging wider participation from vehicle owners will remain a significant challenge. Vehicle owners are more likely to participate when scrapping offers tangible financial benefits through tax concessions, incentives or discounts on new vehicle purchases. At the same time, manufacturers stand to benefit from a more dependable supply of recycled materials, strengthening supply-chain resilience while reducing dependence on newly extracted resources. The advantages extend well beyond the automobile industry. A well-developed vehicle recycling ecosystem can reduce landfill waste, improve air quality by replacing highly polluting vehicles and create new employment opportunities across dismantling, material recovery, recycling, and secondary manufacturing. It also supports India's wider objectives of improving resource efficiency, lowering industrial emissions and promoting circular economy practices within domestic manufacturing. Environmental experts believe that transition cannot end with vehicle recycling alone.A truly circular automotive sector will require vehicles to be designed for easier recycling, valuable materials to be recovered more efficiently, battery recycling systems to expand and manufacturers to take greater responsibility for the entire life cycle of their products. As India's vehicle population continues to grow, the country's next sustainability milestone may not be measured by how many new vehicles are manufactured, but by how responsibly older ones are managed at the end of their life. The programme's success will not be measured by the number of vehicles it dismantles, but by the value it creates from them. It will be measured by how effectively yesterday's vehicles are transformed into tomorrow's resources, reducing waste, conserving raw materials and strengthening India's circular economy. The journey of a vehicle should not end at the scrapyard. In a truly sustainable economy, it should continue through the materials it leaves behind - fueling new industries, conserving natural resources and reinforcing the idea that the most valuable resources are often those already in our hands. Sources: Ministry of Road Transport and Highways (MoRTH) – Vehicle Scrapping Policy: Notifications and Ruleshttps://www.morth.gov.in/en/Circulars-Notifications-related-to-Vehicle-Scrapping-PolicyPress Information Bureau (PIB) – Vehicle Scrapping Policy: Progress of Registered Vehicle Scrapping Facilities (RVSFs)https://www.pib.gov.in/PressReleasePage.aspx?PRID=2099130&lang=2&reg=48National Government Services Portal – Registered Vehicle Scrapping Facility (RVSF) Portalhttps://services.india.gov.in/service/detail/apply-for-registered-vehicle-scrapping-facilityMinistry of Road Transport and Highways – State-wise Registered Vehicle Scrapping Facility (RVSF) Notificationshttps://www.morth.gov.in/en/rvsf-notificationsCentral Pollution Control Board (CPCB) – Environmentally Sound Management of End-of-Life Vehicleshttps://cpcb.nic.in/NITI Aayog – Reports on Circular Economy and Resource Efficiencyhttps://www.niti.gov.in/Down To Earth – Coverage on vehicle scrappage, recycling and the circular economy in Indiahttps://www.downtoearth.org.in/The Energy and Resources Institute (TERI) – Research on resource efficiency, recycling and circular economyhttps://www.teriin.org/Ministry of Steel, Government of India – Steel recycling and secondary raw materials initiativeshttps://steel.gov.in/Press Information Bureau (PIB) – Voluntary Vehicle Fleet Modernization Programme (Vehicle Scrapping Policy)https://www.pib.gov.in/newsite/erelcontent.aspx?lang=2&reg=48&relid=265928 ...Read more

31 Jul 2026

As Europe tightens its carbon border rules, Indian steel, cement and aluminium exporters face a new test of competitiveness   Kolkata | July 31, 2026: What if the next barrier to global trade is not tariffs or product standards, but carbon emissions? As the European Union moves closer to fully implementing its Carbon Border Adjustment Mechanism (CBAM), that question is becoming relevant. The policy is expected to redefine trade in carbon-intensive products, with Indian exports of steel, cement and aluminium among those likely to feel its impact. The Carbon Border Adjustment Mechanism is designed to tackle "carbon leakage"- the practice of shifting production to countries with weaker climate regulations while continuing to supply European markets. Under the new system, importers into the EU will have to pay a carbon price on products manufactured in countries that do not have comparable carbon pricing measures.For Indian exporters, the policy marks a significant shift in the rules of global trade.For India, the stakes are particularly high. The country is among the world's largest producers of steel and aluminium, with the European Union representing an important export market for both. As CBAM moves into its next phase, exporters will need to provide verified emissions data and may face additional carbon-related costs if their products are produced through carbon-intensive processes.Experts say the debate is no longer confined to climate policy. It is rapidly becoming a question of who remains competitive in global markets and who risks being left behind. Steel, cement and aluminium form the backbone of India's industrial economy, but they are also among its most carbon-intensive sectors. Coal-based steelmaking, clinker production in cement manufacturing and electricity-dependent aluminium production all contribute significantly to greenhouse gas emissions. If these industries are unable to reduce their carbon footprint, Indian exports could face higher costs in the European market, making them less competitive than products manufactured using lower-emission technologies. The transition to CBAM is no longer a future concern- it has already begun. Exporters are now required to submit emissions data, while carbon-related costs are expected to rise as the mechanism becomes fully operational over the coming years. Recognising the changing trade landscape, many Indian manufacturers have already started adapting their operations.Industry response is already beginning to take shape. Steel manufacturers are investing in renewable energy, energy-efficient technologies and cleaner production methods such as hydrogen-based steelmaking and electric arc furnaces. Cement companies are reducing emissions through alternative fuels, blended cement and waste-heat recovery systems, while aluminium producers are increasing renewable energy use and improving efficiency throughout their operations. The government is supporting this transition through initiatives aimed at expanding green hydrogen, renewable energy and industrial decarbonisation. At the same time, discussions on carbon markets and green manufacturing standards are gaining momentum as India prepares its industries for evolving global trade requirements.However, significant challenges remain. Experts believe CBAM could also redefine global trade patterns. With European buyers placing greater emphasis on products with lower embedded emissions, sustainability is rapidly emerging as a key factor- alongside price, quality and delivery, in determining who remains competitive in international markets. For businesses, the rules of global trade are beginning to change. Reducing emissions is no longer only about supporting climate action- it is becoming a decisive factor in securing future markets.As carbon costs gradually become important part of global trade, India's steel, cement and aluminium industries are entering a defining phase.  The companies that move early towards cleaner technologies, lower emissions and transparent reporting could strengthen their global competitiveness. Those that wait may discover that in tomorrow's marketplace, the cost of inaction is far greater than the cost of transition. The next chapter of India's export story may be written not only by its factories, but by the carbon footprint they leave behind! Sources: European Commission – Carbon Border Adjustment Mechanism (CBAM)Official overview of CBAM, covered sectors (including steel, cement and aluminium), reporting requirements, and the definitive regime from 2026.European Commission – CBAM Definitive RegimeInternational Energy Agency (IEA) – Carbon Border Adjustment Mechanism (CBAM)Explains the purpose of CBAM, its link with the EU Emissions Trading System (EU ETS), and its role in industrial decarbonisation.IEA – Carbon Border Adjustment Mechanism (CBAM)Economic Survey 2024–25, Government of IndiaDiscusses India's exposure to CBAM, sector-wise export dependence, and the likely impact on iron & steel, aluminium and cement exports. (Invest India)Economic Survey 2024–25 (Government of India)Ministry of Statistics & Programme Implementation (MoSPI) – CBAM: An Opportunity for Generating Higher Revenue from Indian Steel Export through Market DiversificationReviews how CBAM may affect Indian steel exports and explores strategies to maintain export competitiveness. (Ministry of Statistics)MoSPI – CBAM and Indian Steel Exports ReportThe Economic Times – India-EU FTA Includes Dedicated Framework to Address CBAM ConcernsCovers recent developments on how India and the EU are addressing CBAM through ongoing trade negotiations. (m.economictimes.com)India-EU FTA and CBAM Framework ...Read more

31 Jul 2026

From overseas investments to recycling and responsible mining, India's critical minerals strategy is entering a decisive phase Kolkata | July 30, 2026:Every electric vehicle, solar panel, wind turbine and battery storage system relies on a set of resources that often remain out of public view- critical minerals.    Lithium, cobalt, nickel, graphite and rare earth elements, have become indispensable to the global clean energy transition, making them strategically important today as fossil fuels were in the past. As countries accelerate efforts to decarbonise their economies, India is also strengthening its approach in securing these resources. Through overseas partnerships, investments in mineral-rich regions, domestic refining, recycling initiatives and policy reforms, the country is working to build a more resilient critical mineral supply chain. The objectives extend beyond supporting renewable energy projects. It is also about strengthening energy security, expanding domestic manufacturing and reducing dependence on imports. The urgency has grown as global competition for critical minerals continues to intensify. Much of the world's refining and processing capacity remains concentrated in a few countries, leaving supply chains vulnerable to geopolitical tensions, trade restrictions and market disruptions.In response, India is focusing on a two-pronged approach-strengthening international cooperation to secure mineral supplies while building domestic refining capacity to convert raw minerals into battery-grade materials at home.Experts say this reflects an important shift in the global conversation. Securing access to mineral deposits is no longer enough. Gradually, countries are seeking greater control over the entire value chain - from extraction and refining to manufacturing, recycling and reusing. Recycling is emerging as another key part of this transition. As electric vehicle adoption grows, used batteries and electronic waste are expected to become valuable secondary sources of lithium, cobalt and nickel. Recovering these materials can reduce pressure on fresh mining, lower environmental impacts and strengthen resource security while creating new opportunities in advanced recycling and material recovery. Although recycling alone cannot meet future demand, experts believe it will play an important role in building a more circular economy.Securing critical minerals is necessary, but far from sufficient. Mining often takes place in ecologically sensitive regions that support forests, rivers and Indigenous communities. Around the world, concerns over biodiversity loss, land acquisition, water stress and community displacement have intensified alongside expanding mineral exploration. Conservationists argue that the transition to clean energy should not come at the expense of environmental protection or local livelihoods. This has elevated responsible mining to a core priority.Experts believe every critical mineral project should include transparent environmental assessments, meaningful community consultation, fair compensation and continuous ecological monitoring. They stress on a fundamental shift: local communities must be partners in building the future, not just recipients of its consequences. The discussion reflects a broader evolution in the sustainability agenda. Climate action is no longer measured only by the number of renewable energy projects or electric vehicles on the road. It also depends on whether the resources powering these technologies are extracted responsibly, processed efficiently and managed sustainably throughout their life cycle.For India, the years ahead will determine whether industrial growth, resource security and environmental responsibility can advance together. Progress will depend not only on overseas agreements or new processing facilities, but on building a supply chain that is transparent, resilient and socially inclusive. Ultimately, the clean energy transition will be defined not just by what we build, but by how we build it. It will also be judged by the choices made long before those technologies reach consumers.   The countries that lead the future will not simply be those with the largest mineral reserves, but those that develop supply chains that are ethical, resilient and circular. For India, the real challenge is not only securing the minerals that power a greener economy, but proving that sustainable development begins with responsible decisions at every stage of the journey! The true success of the clean energy transition lies not only in its destination, but in ensuring that every step along the way is sustainable. Sources: Ministry of Mines, Government of India – National Critical Mineral Mission, policy updates and official announcements.Ministry of Mines – Critical MineralsCouncil on Energy, Environment and Water (CEEW) – Analysis on the India–US Critical Minerals Agreement, domestic processing and supply-chain resilience.India–US Critical Minerals: The Midstream Test (CEEW) Ministry of External Affairs (MEA) – Quad Critical Minerals Initiative Framework and international cooperation.Quad Critical Minerals Initiative FrameworkInternational Energy Agency (IEA) – Critical Minerals Policy Tracker covering global supply chains, recycling and responsible mineral policies.IEA Critical Minerals Policy TrackerReuters – Reporting on India's expanding critical mineral partnerships and efforts to strengthen exploration, processing and recycling.India in talks over critical minerals partnerships ...Read more

27 Jul 2026

Why mangroves matter to our coasts, climate, livelihoods and future Research-based feature by Prof Ujjwal K Chowdhury A World Mangrove Day feature | July 26, 2026 Mangroves grow where ordinary trees would die. They stand in salt water, breathe through roots, raise land with trapped sediment and protect people who may never know the full value of the forest before them. On World Mangrove Day, their story is also the story of the fisher, the honey collector, the child on an embankment and the city living behind a distant green wall. Where the Tide Enters Everyday Life At dawn in the Sundarbans, the boundary between land and water is never still. A fisher pushes a narrow boat into a creek. A woman checks a honey basket before the heat rises. A child walks along an embankment that may have to face the next cyclone. Around them stand trees that look almost impossible: trunks in salt water, roots rising out of mud, leaves shining above a tide that comes and goes twice a day. These are mangroves, and for millions of coastal people they are not scenery. They are security. July 26 is observed as the International Day for the Conservation of the Mangrove Ecosystem, commonly called World Mangrove Day. UNESCO established the day in 2015 to bring attention to an ecosystem that is rare, productive and deeply vulnerable. Mangroves receive less public affection than mountains, rainforests or charismatic wildlife because much of their life is hidden in muddy creeks and waterlogged soil. Yet their work is visible every time they slow a wave, hold a riverbank, shelter a young fish or protect a village before the first rescue team arrives. This day matters because mangroves are disappearing under pressure from aquaculture, urban growth, ports, roads, pollution, dams and rising seas. It also matters because a ceremonial plantation photograph can create the false belief that the problem has been solved. A mangrove is not simply a sapling placed in wet soil. It is a complete relationship among tides, freshwater, sediment, salinity, wildlife and people. World Mangrove Day should therefore be a yearly public audit: Are existing forests safe? Are newly planted trees surviving? Are tidal channels open? Are local communities gaining rights and livelihoods? Are development projects treating mangroves as living infrastructure rather than vacant land? A mangrove is not just a tree in mud. It is a coastal safety system built by nature. A Forest Built for Salt, Mud and Survival Mangroves are groups of salt-tolerant trees, shrubs and palms that grow in the intertidal zone, the strip of coast covered at high tide and exposed at low tide. They are found around estuaries, deltas, lagoons, creeks and sheltered tropical or subtropical shores. Ordinary plants struggle in salty, waterlogged and oxygen-poor soil. Mangroves have evolved remarkable ways to live there. Some block salt at the roots. Some remove salt through their leaves. Some send pencil-like breathing roots, called pneumatophores, above the mud to take in air. Others grow arching prop roots that act like stilts, steadying the tree while slowing water and trapping sediment. They are not one type of tree. Roughly 80 recognised mangrove tree and shrub species occupy different levels of the tidal landscape. One may tolerate stronger salinity near open water; another may need more freshwater and grow farther inland. This zonation is why a natural mangrove forest looks irregular and layered. It is also why a row of identical saplings cannot automatically replace a mature forest. Diversity is not decoration. It is the system's insurance against disease, salinity change, storms and other shocks. A Rare Green Belt Around the World - and Bengal's Great Share The world's mangroves covered about 14.8 million hectares in 2020 and occurred in 123 countries and territories. Nearly 44 per cent lay in South and Southeast Asia. Indonesia holds the largest area, while Brazil, Nigeria, Mexico and Australia are also major mangrove countries. Together, the five account for almost half of the global resource. Large mangrove landscapes also survive along the Amazon and Atlantic coasts of South America, the Niger Delta and West Africa, northern Australia, Papua New Guinea, the Caribbean and the coasts of South Asia. Globally, mangroves are extensive enough to sustain fisheries and coastal settlements, but rare when compared with other forests. They cover less than one per cent of the world's tropical forest area. FAO estimates show a net global decline of about 284,000 hectares between 2000 and 2020. The rate of loss slowed in the second decade, which proves that protection can work, but the total pressure remains severe. The first global IUCN assessment found that half of assessed mangrove ecosystems are at risk of collapse and nearly one-fifth are at high risk. India has around 5000 square kilometres of mangrove cover, according to the India State of Forest Report 2023. This is only 0.15 per cent of the country's geographical area, yet it performs a disproportionately large role in food security, disaster protection and biodiversity. The main regions are the Sundarbans in West Bengal; the Gulf of Kutch and Gulf of Khambhat in Gujarat; the Andaman and Nicobar Islands; the Krishna and Godavari deltas; Bhitarkanika and the Mahanadi delta; Pichavaram and Muthupet; and the mangrove belts around Mumbai, Thane, Raigad and Ratnagiri. West Bengal is India's mangrove capital. Its 2,119.16 square kilometres amount to more than two-fifths of the national total. Almost all of this lies in the southern coastal districts, especially South 24 Parganas. The Sundarbans, shared by India and Bangladesh, is the world's largest mangrove forest and a vast living maze created by the Ganga, Brahmaputra and Meghna river systems. It is a tiger habitat, a fish nursery, a cyclone buffer and a human landscape of islands, farms, embankments, boats and villages. The future of the Sundarbans is therefore tied not only to remote island communities but also to the safety of Kolkata and the wider Bengal delta. Mangroves Grow When Water Is Allowed to Move Mangroves are hardy, but they cannot be planted anywhere that looks muddy. They grow best in warm, frost-free weather, usually in sheltered tropical and subtropical waters where waves are not continuously violent. They need regular tides that carry water, nutrients, seeds and fine sediment. They need the right balance of salt and fresh water. They need soft soil at the correct height in relation to the tide. Above all, they need a functioning water system. There is no single best month for every Indian coastline. The monsoon and post-monsoon season may provide useful moisture and seed availability in many places, but local tides, rainfall, elevation and species matter more than the date on a plantation calendar. A sapling placed too low may drown or be washed away. One placed too high may not receive enough tidal water. A species suited to a saline outer creek may fail in a freshwater-influenced inner zone, and vice versa. The most important human intervention is often not planting but ecological repair. Illegal pond walls may need to be breached so tides return. Blocked creeks may need to be reopened. Dams, barrages and excessive withdrawal upstream must be managed so freshwater and sediment can still reach deltas. Grazing, dumping, cutting and trampling must be controlled. Native species must be matched to the exact site. Once the hydrology is restored, floating seeds and propagules can settle naturally, creating a more diverse and resilient forest than a hurried monoculture plantation. Mangroves also need space to move inland as sea level rises. Where roads, walls, industries or settlements block that movement, the forest becomes trapped between development and the advancing sea. Scientists call this coastal squeeze. A serious restoration policy must therefore protect migration space, not only today's tree line. One Forest, Many Strengths Different mangroves perform different jobs. Avicennia species are often first settlers on new mud. Their pencil-like breathing roots stabilise soft ground, tolerate considerable salinity and prepare the site for other life. Rhizophora species form dramatic prop-root walls that slow water, trap sediment and create hiding places for young fish, prawns and crabs. Sonneratia commonly grows near channels and estuaries; its roots, flowers, fruit and falling leaves feed a wide aquatic web. Excoecaria agallocha, often called gewa or blind-your-eye mangrove because its sap can irritate the eyes, grows on relatively higher ground and helps bind riverbank soil. Bengal's signature tree is the Sundari, Heritiera fomes, from which the Sundarbans takes its name. It carries ecological and cultural meaning, but it is globally threatened and sensitive to changing salinity and disease. Nypa fruticans, known locally as golpata in parts of the delta, is a mangrove palm whose leaves have long been used for roofing and thatching; elsewhere in Asia its sap is turned into sugar and vinegar. Bruguiera, Ceriops, Aegiceras, Xylocarpus and Phoenix paludosa add further layers of habitat and protection. In some regions, fruits of Sonneratia and processed products from Avicennia are used as food, while mangrove plants remain subjects of research for antioxidant, antimicrobial and other medicinal properties. Such uses should be scientifically tested and harvested within ecological limits. Together, these species create a living wall. The outer roots take the first force of waves. The forest slows currents. The roots hold soil. Sediment settles. Floodwater spreads with less destructive energy. Mangroves cannot stop every cyclone and should not be presented as a magical substitute for embankments, shelters, warning systems or evacuation plans. But a broad, healthy mangrove belt combined with well-designed infrastructure is often safer and more economical than concrete alone. The forest is also a fish factory. Juvenile fish and shellfish shelter among the roots, feed on leaf litter and later move into rivers and the sea. Birds nest and feed there. Crocodiles, turtles, dolphins, fishing cats, insects and countless smaller organisms depend on the connected landscape. For people, the same forest supports fishing, crab collection, honey and beeswax, leaves, crafts, nature guiding and tourism. The commercial benefit begins with the simple fact that a living mangrove keeps producing value year after year. The Crisis Is Not Only Cutting - It Is Bad Restoration The old image of mangrove destruction is a chainsaw. Today's crisis is more complicated. Forests are cleared or enclosed for shrimp ponds, salt pans, ports, roads, tourism and real estate. Urban sewage, plastic, industrial chemicals and oil choke roots and poison the food web. Dams and river engineering reduce freshwater and sediment, raising salinity and weakening the delta. Climate change adds higher seas, stronger storm impacts, erosion and changing rainfall. The second crisis is restoration that looks successful on paper but fails in the mud. Authorities may announce lakhs of planted seedlings without reporting how many remain alive after three or five years. Easy-to-grow Avicennia may be planted in straight rows everywhere, even where another species or natural mudflat should remain. Saplings may be pushed into deep water, exposed shorelines, seagrass beds or sites cut off from tides. Some projects protect the planting for a photograph but not from grazing, waves, garbage or later encroachment. A larger green patch on a satellite image does not necessarily mean a healthier ecosystem. The patch may be a young single-species block with little fish or bird life. It may have poor water exchange or weak soil. Real success must be judged through survival, natural regeneration, species diversity, tidal flow, sediment condition, fisheries recovery, carbon accumulation and benefits to local people. The first rule should be to protect mature forests, because an old, diverse mangrove and its deep soil carbon cannot be recreated quickly by planting new saplings elsewhere. Plantation numbers are easy to announce. A living, diverse forest is much harder to create. Blue Carbon - The Wealth Hidden Under the Mud Mangroves absorb carbon dioxide while growing. Some carbon remains in trunks, branches, leaves and roots, but a very large share enters waterlogged, oxygen-poor soil where decomposition is slow. Carbon held in coastal ecosystems such as mangroves, seagrasses and salt marshes is called blue carbon. UNEP reports a global average mangrove carbon stock of around 1,000 tonnes of carbon per hectare, including soil, though the real figure varies greatly by location, age, depth and ecology. Per unit area, mangroves can hold several times more carbon than many land forests, with much of it safely buried below ground. Two ideas are often confused. Carbon stock is the carbon already stored in an existing forest and its soil. Carbon sequestration is the additional carbon captured over time. Protecting an old mangrove saves a huge existing stock and prevents emissions from damaged or drained soil. Restoring a degraded site may gradually add new carbon, but it does not instantly replace what was lost. Mangrove carbon farming means protecting, restoring or scientifically expanding mangroves in ways that increase storage or avoid emissions. A credible project must prove that the climate benefit is real and additional, meaning it would not have happened without the project. It must measure carbon through field plots, tree data, soil sampling and remote sensing. It must show permanence, prevent destruction from merely shifting elsewhere, avoid double counting and explain what happens if a cyclone damages the forest. Accounting may also need to consider methane and nitrous oxide, especially where water flow has been badly altered. This is why blue-carbon credits are an opportunity, not free money. Measurement, reporting and verification take years. Land and carbon rights must be clear. Independent checks cost money. Carbon prices change. Claims can be exaggerated, and companies can use cheap credits as a public-relations shield while avoiding deeper cuts in their own emissions. Carbon finance should support genuine climate action, not become a licence to pollute. A Mangrove Economy Must Reward the People Who Keep It Alive The commercial value of mangroves is much wider than carbon credits. They support fish, prawns, crabs and shellfish; protect houses, farms, roads and businesses; reduce erosion and embankment repair; improve water quality; sustain honey, wax and plant products; and create work in nurseries, monitoring, guiding, kayaking, wildlife tourism and research. Some insurers and coastal investors are beginning to see mangroves as natural infrastructure because reducing storm and flood damage also reduces financial risk. A World Bank study in Indonesia estimated that the combined services of mangroves average about USD 15,000 per hectare per year, with some locations approaching USD 50,000. These figures cannot be copied directly into an Indian project, because population, fisheries, land value and storm exposure differ. But they show why the standing forest may be worth far more than the one-time profit from clearing it. West Bengal's experience with sustainable aquaculture offers another path. Models such as Sustainable Aquaculture in Mangrove Ecosystems, or SAIME, try to combine fish and shrimp production with the restoration of mangrove vegetation rather than creating closed ponds after total clearance. When carefully managed, such systems can improve water quality, reduce disease risk, diversify incomes and sell responsibly produced seafood at a better price. Carbon revenue can help pay for nurseries, community guards, scientific monitoring, cyclone preparedness, women's self-help groups and alternative livelihoods. Yet a project becomes unjust when outside developers own the contracts while fishers, honey collectors and island residents do the work and lose access to the forest. Every agreement should openly state who owns the carbon rights, who receives the money, who carries the risk, how long protection will continue and how customary access will be respected. The best mangrove economy is not based on fencing people out. It is based on keeping the forest alive while rewarding those who protect it. The greatest commercial benefit of mangroves is a coast that remains alive, productive and safe. From a Government Scheme to a People's Movement India has a policy foundation for action. The Mangrove Initiative for Shoreline Habitats and Tangible Incomes, or MISHTI, was launched on June 5, 2023. Government reporting stated that 22,560.34 hectares of degraded mangrove area had been taken up through convergence across 13 States and Union Territories by August 2025, while additional work received gap funding through National CAMPA. Reporting for 2025 cited 4,536 hectares brought under restoration during that year, and in June 2026 the Union environment minister referred to a national target of restoring 54,000 hectares by 2028. The Coastal Regulation Zone Notification of 2019 classifies mangroves as ecologically sensitive areas and provides a 50-metre buffer where mangrove cover exceeds 1,000 square metres. Where development affects mangroves, compensatory planting at three times the number lost is required. But the ecological lesson is important: three saplings are not the same as one mature tree, and a planted patch is not the same as an old tidal forest. Regulation must prevent destruction first, not merely promise replacement later. For mangroves to become a national environment movement, they must connect causes that are often kept separate: climate action and disaster protection, river health and coastal security, fisher rights and biodiversity, women's livelihoods and community leadership, city planning and wetland protection, science and traditional knowledge. Mumbai, Kolkata, Chennai, Kochi, Visakhapatnam, Surat and other coastal cities depend on healthy creeks and buffers even when citizens rarely see the connection. The movement needs public survival audits for every funded plantation, with locations, species, spending and three-to-five-year results placed online. It needs mangrove clubs in schools and colleges, community nurseries run by women's groups, citizen mapping of blocked creeks and pollution, and green-grey engineering that combines natural buffers with appropriate embankments. Most importantly, fishers, farmers, honey collectors and island residents must sit at the planning table and receive a fair share of benefits. Conservation becomes durable when local people are not treated as threats but as partners and knowledge holders. Mangrove warriors like teachers Uma Shankar Mandal and Ramkrishna Sarkar of the Sundarban area have taken up this battle with the help of local women, creating mangrove armies of women, planting trees, taking care of them, and getting small support in kind for the women from the society at large. Their valiant work has created areas with more than half a million mangrove trees in various blocs of Sundarban. What One Citizen Can Do - Even Far From the Sea A person living hundreds of kilometres inland still sends waste towards the coast through drains and rivers. Reducing single-use plastic and chemical pollution is therefore mangrove action. So is asking where prawns and shrimp come from, because destructive aquaculture remains a major driver of clearing. Travellers can choose community homestays, local guides and responsible boat operators rather than tourism that disturbs wildlife or dumps waste. People who donate to plantation campaigns should ask harder questions. Was the site historically a mangrove area? Is tidal water reaching it? Are native species being used? Are local residents involved? Who will protect the saplings for at least three to five years? Is the project restoring a forest or merely counting trees? Random planting is not helpful; scientific, community-based ecological restoration is. Citizens can photograph and report illegal dumping, burning, creek blockage, land filling and cutting. Students can adopt a creek, document birds and crabs, measure plantation survival, interview coastal residents and create local-language awareness material. Consumers can support legally and sustainably produced honey, handicrafts and seafood. Social media users can make mangroves visible not only on July 26 but whenever a port, road, resort or real-estate project threatens a tidal ecosystem. The message of World Mangrove Day is finally very simple. A mangrove is a storm barrier, fish nursery, carbon vault, wildlife home, water filter and source of work. It protects a village before a rescue vehicle arrives and supports a fishing family without appearing in a conventional balance sheet. We should not merely plant a mangrove. We must protect the water, soil, wildlife and people that allow an entire mangrove forest to live.   Research and Source Note This feature fully synthesises the attached background document and cross-checks time-sensitive figures against official or primary institutional sources available up to July 2026. The economic values cited from Indonesia illustrate the scale of ecosystem services and should not be transferred directly to Indian sites without local valuation. UNESCO - International Day for the Conservation of the Mangrove Ecosystem - Open official source FAO - The World's Mangroves 2000-2020 and global distribution data - Open official source IUCN - Red List of Mangrove Ecosystems global assessment - Open official source Forest Survey of India - India State of Forest Report 2023 - Open official source Press Information Bureau - Mangrove conservation and ISFR 2023 state-wise cover - Open official source Press Information Bureau - MISHTI implementation across States and Union Territories - Open official source UNEP - Mangrove forests and blue-carbon stocks - Open official source IPCC AR6 Working Group III - Reducing conversion of coastal wetlands - Open official source World Bank - Economics of large-scale mangrove conservation and restoration in Indonesia - Open official source ...Read more

27 Jul 2026

As demand for solar power grows, a less visible challenge is beginning to shape the future of India's clean energy ambitions.   Kolkata | July 27, 2026: India's solar sector has grown rapidly in recent years, accelerating the country's transition towards cleaner energy. But behind the expansion of solar parks and rooftop systems lies a challenge that could shape the pace of future growth! As domestic production grows and the Approved List of Models and Manufacturers (ALMM) continues to evolve, the focus is no longer on installing more solar panels. It is on whether India can build a resilient, self-reliant manufacturing ecosystem capable of overcoming long-term supply chain challenges. The biggest hurdle is the limited availability of solar cells. Although India's module manufacturing capacity has grown rapidly, many manufacturers still rely on imported cells to keep production on track. While experts expect supply pressures to ease in the coming years, companies are gradually adopting vertical integration - expanding in-house manufacturing to strengthen supply chains and build long-term resilience. The challenge extends beyond manufacturing more solar panels. Producing a solar module involves several stages-from processing polysilicon into wafers, converting those wafers into solar cells, and finally assembling them into modules. Experts say strengthening every step of this value chain is essential for reducing import dependence and building a more flexible domestic manufacturing ecosystem.  How a Solar Panel Is Made:   POLYSILICON         │ Purified silicon used as the raw material         ↓  WAFERS Thin slices cut from polysilicon ingots         ↓ SOLAR CELLS Convert sunlight into electricity         ↓ SOLAR MODULES Multiple solar cells assembled into a panel         ↓ SOLAR POWER SYSTEM Installed in homes, industries and solar parks   Source: MNRE, Industry reports The revised Approved List of Models and Manufacturers (ALMM) framework is reinforcing the push for domestic manufacturing. But the next phase will depend on execution.Can local solar-cell production expand fast enough to meet the rising demand? Will manufacturers be able to scale up without increasing costs? And how quickly can new production capacity become operational?   India's Solar Manufacturing Gap Manufacturing SegmentCurrent SituationPolysiliconLimited domestic capacityWafersDevelopingSolar CellsSupply remains constrainedSolar ModulesStrong manufacturing capacity Project developers are closely monitoring these changes. Many say procurement decisions are now being shaped by domestic content requirements. While stronger local manufacturing could improve long-term supply security, companies are also evaluating its impact on equipment availability, delivery timelines, and overall project costs during the transition. Manufacturers believe the long-term solution lies in enhancing the entire supply chain. They say expanding domestic solar-cell production, bringing new manufacturing facilities online, and improving access to advanced technologies can help ease future shortages while making Indian-made solar equipment more competitive in global markets.According to industry experts, the focus shouldn’t be limited to large manufacturers. Smaller technology firms, component suppliers, and equipment makers are also expected to play a crucial role in strengthening India's solar manufacturing ecosystem. Better access to finance, technology partnerships, and supportive policies could let a wider range of businesses fuel the move towards cleaner energy. Experts say stronger collaboration between the government, industry, and project developers will be essential. Clear regulations, reliable procurement policies, and sustained investment in domestic manufacturing can help strengthen the entire solar value chain, pushing India beyond mere panel assembly.     India's clean energy ambitions depend not only on installing more solar panels but also on building a stronger domestic manufacturing ecosystem. While current supply constraints may be temporary, the decisions made today could shape the country's ability to develop a globally competitive solar industry in the coming years. As India's clean energy transition gathers pace, the next phase will depend not only on expanding solar capacity but also on strengthening every stage of the solar manufacturing value chain.    Sources: Ministry of New and Renewable Energy (MNRE)  Approved List of Models and Manufacturers (ALMM)  Solar Energy Corporation of India (SECI)  Ministry of Commerce & Industry (Government of India)   Open-source industry reports on India's solar manufacturing and supply chain ...Read more