
Total Articles 231+

Core Review Streams

Covers key sustainability themes, analyzing practices, challenges, and innovations shaping environmental and corporate responsibility.

Showing 12/65

05 Sep 2026

How schools and universities can use AI to deepen learning - without outsourcing the learner  September 2026 AI can transform education, but it should never replace the learner. The future of learning lies in keeping students thinking, questioning, verifying and taking responsibility while using AI as a tool for deeper understanding. SummaryAI is reshaping education by making it possible for students to produce polished work before they have truly understood the underlying ideas.The article argues for a human-led learning loop in which AI provides support, while learners and teachers retain purpose, judgement, verification and accountability. Its proposed “AI Sandwich” puts the human first, AI in the middle and the human last—ensuring students attempt, question, verify, revise and explain their work themselves. Teachers, meanwhile, must become learning architects who use AI to strengthen teaching rather than substitute for human guidance and relationships. Ultimately, sustainable AI-enabled education should be measured not by how polished the final output looks, but by what the learner can still think, explain, apply and do when the screen goes dark. Education is entering a strange new phase: a student can hand in a fluent essay, working program or persuasive presentation before understanding the ideas inside it. The answer is not to ban AI or surrender to it. The sustainable path is a human-led learning loop in which AI expands reach, while teachers and learners retain purpose, judgement, verification and responsibility. THE NON-NEGOTIABLE  AI may raise the quality of a learner's output. It must never hide whether the learner can formulate, think, verify, explain, transfer and take responsibility. A polished answer can be a learning failure At 10:15 on a Tuesday morning, a Class 10 mathematics teacher asks a student to change one number in a problem she has just submitted. The answer on the screen is flawless: neat steps, correct notation, a confident conclusion. The student stares at the altered problem. The path has disappeared. She remembers the answer, not the reasoning. This is the new educational anxiety in miniature. A learner can move from a vague prompt to a polished essay, presentation, image, translation, spreadsheet or program before building the mental model that the work seems to prove. The problem is not simply that a student may have cheated. The deeper problem is that the artefact has outrun the learner. The OECD's Digital Education Outlook 2026 makes the distinction plainly: generative AI can support learning when guided by sound teaching principles; when it merely takes over tasks, it can improve performance without producing real learning gains. [1] A large field experiment in high-school mathematics reached an equally uncomfortable conclusion: unguarded access helped students while the tool was present but weakened later unaided performance. Guardrails changed the result, but access alone did not. [5] That is why sustainable education must be defined more seriously than "education with more devices". It is learning that lasts after the screen goes dark; relationships that keep a learner curious and accountable; access that does not depend on a premium account or perfect English; privacy that protects dignity; and a teaching system in which time saved by automation is reinvested in human attention. The target is not less AI. It is more learner. The bargain must change: AI for leverage, humans for meaning AI can do useful work in education. It can produce extra examples, translate a difficult explanation, simulate a debate, suggest a counterargument, generate code tests, organise observations or give a learner a second chance to ask the same question without embarrassment. Those are real gains in reach and access. But AI cannot decide what a particular learner needs to understand, what a community considers fair, which uncertainty matters or what a student is ready to do alone. It cannot replace the teacher who notices the pause before a child answers, the confidence that is slipping, the misconception hidden inside a correct sentence or the ethical consequence of a proposed solution. Human-in-the-loop therefore cannot mean that a teacher sees the final file and clicks "approved". That is a rubber stamp. A real loop puts human purpose, dialogue and accountability before, during and after AI use. The better learning chain is: question, attempt, AI dialogue, evidence, demonstration and reflection. UNESCO's student framework gives this idea a global vocabulary. It describes 12 competencies across a human-centred mindset, ethics of AI, AI techniques and applications, and AI system design, progressing from understanding to applying to creating. Its teacher framework names 15 competencies across human-centred thinking, ethics, AI foundations, AI pedagogy and professional learning. Both frameworks place human agency, inclusion and sustainability at the centre. [2] [3] AI literacy cannot be an isolated workshop on clever prompts. It must sit inside science, languages, history, mathematics, design, engineering, medicine, business and the arts. The subject still supplies the questions and standards; AI is one instrument in a larger human practice. Why deep learning needs friction Learning is not the same as recognition. A student may recognise a good explanation on a screen and still be unable to retrieve the concept, connect it to prior knowledge, detect an error, explain a choice or use the idea in a new situation. Durable learning needs carefully designed effort. Learning research gives schools and universities a practical spine: retrieve before reviewing; engage actively instead of only listening; plan, monitor and evaluate one's thinking; act on feedback; and return to the idea later in a different context. Retrieval practice helps across subjects and levels, while a major PNAS review found that active learning improves performance and reduces failure in undergraduate STEM compared with traditional lecturing. [6] [7] AI is powerful precisely because it can remove effort. Sometimes that is the point: accessibility tools, language support and a simulation can open a door that was previously closed. But when the learner has not yet made the first attempt, instant completion removes productive friction - the small struggle through which a mental model is built. A robust learning loop has seven moves. The learner retrieves, frames the problem, struggles productively, stress-tests an idea, rebuilds the work, explains it to someone else, and transfers it to a new problem. AI can support every move, but it must not silently perform every move. The critical question is: what changed in the learner's thinking because of the interaction? THE REVEAL RULE  AI should reveal the next useful step only after the learner has shown the current step. If a complete answer is necessary for accessibility or safety, the learner must still reconstruct, explain and apply the essential idea independently afterwards. The sandwich method: think, ask, own The most memorable classroom rule is the AI Sandwich: human first, AI in the middle, human last. It is not a fixed percentage of human and machine work. The layers grow or shrink with age, subject, risk and expertise. Its purpose is to keep thinking visible. Human first means that the learner starts. The student recalls what she knows, makes a prediction, draws a diagram, writes a rough thesis, attempts the equation, sketches the code architecture, or names the people affected by a policy decision. This first move gives the teacher something to teach and gives the learner something to compare. AI in the middle means that the tool receives one clear job. It may ask a question, offer a hint, translate, simulate an opposing viewpoint, generate a counterexample, critique structure, vary practice problems or organise raw observations. It should not automatically become the ghostwriter, ghost coder or ghost researcher. Human last means that the learner verifies, revises in an authentic voice, explains the result, defends a choice and tries a new version. The teacher, tutor, peer, supervisor or community member sees the reasoning. A human owns the judgement, the grade, the safeguarding decision and the appeal. The sandwich in practice LayerLearner doesAI may doHuman safeguardHuman firstAsk, recall, predict, sketch, plan and name constraints.After the first attempt, offer examples, clarifying questions or a checklist.Teacher checks the starting model.AI middleChoose, question, test, interpret, collaborate and revise.Give hints, counterexamples, translation, simulation or structure feedback.Teacher listens for active reasoning.Human lastVerify, rebuild, explain, defend and transfer.Suggest tests, gaps, rival explanations or a challenge case.Learner signs off; human judges.Human accountableSet boundaries, protect data, support the learner and own consequences.Triage, cluster, translate and flag patterns for review.Named human owns grade and appeals. The method changes the questions learners ask. "Solve this" becomes "I tried X; give me one hint, ask me one question and wait." "Write my essay" becomes "Interrogate my thesis, identify a counterclaim and suggest sources I can verify; do not write the paragraphs." "Fix my code" becomes "Read the failing test, point to the likely concept error and give me a diagnostic question." The prompt is a learning decision. The questions that keep the learner awake Every learner should carry a small internal checklist before opening an AI tool. These questions turn AI use from consumption into a conversation with purpose. Ask yourselfWhy it mattersWhat am I trying to learn, not just submit?Names the capability that must remain after the task.What is my first attempt or current idea?Protects retrieval, ownership and productive struggle.What exact job am I giving AI?Prevents a vague request from becoming total delegation.What could be wrong in this output?Starts verification instead of rewarding fluency.Which sources, data, calculations, code, images or assumptions must I check?Turns a plausible answer into evidence.Can I explain, defend and redo the essential part without the same support?Tests ownership, transfer and responsible confidence. Teachers must become learning architects The teacher of the AI era is not a proctor with a chatbot. The teacher is a learning architect: someone who chooses the right challenge, sees how a learner is thinking, builds confidence without lowering standards, connects a concept to lived context and decides when technology must step back. A practical teacher workflow has five moves. First, design: use AI privately to generate misconceptions, examples, alternative explanations and question sequences, then reject anything inaccurate, tone-deaf or misaligned. Second, diagnose: use retrieval tasks, exit tickets and student talk; AI may cluster patterns, but the teacher interprets them. Third, facilitate: allow hint-first practice while the teacher circulates, listens and asks follow-ups. Fourth, demonstrate verification and uncertainty. Fifth, reflect on which AI move helped and which human exchange was indispensable. This is not a romantic argument for ignoring scale. It is a better use of scale. In the Tutor CoPilot randomized trial, 900 tutors worked with about 1,800 K-12 students. Students whose tutors had access to AI guidance were four percentage points more likely to master topics; the gain rose to nine points for students paired with lower-rated tutors. The tool did not replace the tutor. It nudged tutors toward guiding questions and away from giving away the answer. [8] A separate randomized study of 194 undergraduates compared a purpose-built AI physics tutor with an active-learning class. The AI group achieved higher post-test scores, but the tutor was carefully sequenced, grounded in teacher-provided content and designed around active engagement. The authors explicitly warn against treating the result as proof that a generic chatbot is a teacher. [9] The lesson is simple: pedagogy first, tool second. MENTORING RULE  Teachers should teach students how to integrate AI into a task, not merely tell them whether AI is allowed. Demonstrate the prompt, the pause, the verification and the refusal - then ask the learner to do the same. From Class 5 to the capstone The human loop becomes more independent as learners grow, but it never disappears. A four-year-old needs conversation, play and motor activity; a sixteen-year-old needs source judgement and ethical reasoning; a university student needs method and professional judgement. The cases below show what this looks like on an ordinary Monday. Class 5: the school water audit Children begin with a local question: which taps in the school waste the most water? Before AI appears, teams observe, count, measure where possible, interview the caretaker, draw a map and make a prediction. AI can organise observations, translate interview questions and offer possible explanations. Children label each claim as observed, reported, calculated or proposed, make a graph, explain it and test one low-cost change for a week. The teacher blocks invented local facts and asks, "What did you actually see?" The assessment is evidence that a child can observe, reason, communicate and act. Class 7: the source duel in history Students compare a textbook passage, a primary source and an AI-generated summary of a local or national event. They first write what they think happened and what they are unsure about. AI then plays a confident but fallible debate partner: it makes a claim, while students search for supporting passages, missing voices, loaded words and contradictions. In a live rebuttal, one student defends the interpretation and another challenges it. Marks reward evidence and revision, teaching that fluent language is not automatically neutral or accurate. Class 9 or 10: hint-first mathematics A student spends seven minutes attempting an algebra or geometry problem and submits a trace of the first approach. Only then may an approved tutor give one hint, ask one question or show a related example. The evidence stack contains the first attempt, hint history, corrected solution, explanation of one error and a new problem attempted without AI the next day. The child learns to ask for help without asking for substitution. Class 11 or 12: AI versus the field In biology or environmental science, teams ask why a nearby pond, crop or public-health indicator is changing. AI proposes hypotheses, variables, a sampling plan and confounders; students reject suggestions that do not fit local access, ethics, equipment or consent. They compare predictions with field data, graph uncertainty and answer, "What would change your mind?" The lab notebook, data provenance and oral method defence matter more than a smooth slide deck. Undergraduate engineering: code that can be defended A student team building a sensor workflow or data pipeline begins with an architecture sketch and a manually written acceptance test. AI may suggest code, comments, tests and alternative designs. Each member owns a module, records accepted and rejected suggestions, and completes a short live debugging task with the tool restricted. Assessment covers version history, edge cases, security, data flow and a post-mortem on one wrong AI suggestion. Engineers must know why it works, when it fails and who could be harmed. Law, public policy and communication: the memo meets the citizen Students draft a policy memo on transport, housing, water or campus safety. AI can structure the memo, generate counterarguments or test clarity, but students verify every legal or empirical claim, speak to a stakeholder or use a local evidence pack, and defend one value choice in person. They revise after new evidence arrives, showing they can update a judgement rather than protect a paragraph a machine has made sound. Teacher education and doctoral research A trainee teacher may ask AI for likely misconceptions and language supports, then select what fits this class, teach the lesson, review student talk with a mentor and identify one child who was still not reached. A doctoral researcher may map terminology, translate abstracts, stress-test a protocol or propose rival explanations, but must check every paper, citation, data trail and limitation. In both cases, the human professional owns the judgement and the supervisor asks: why does this method answer this question? Assessment: stop chasing the chatbot When AI can produce plausible prose, code, images, calculations and presentations, a detector is the wrong centre of gravity. The useful question is not, "Can we prove a machine touched this file?" It is, "What evidence shows what this learner can do?" The Australian regulator TEQSA has argued for assessment built around active learning, authentic engagement, contextualised evidence, fairness, accessibility, transparency, equity and privacy. Its implementation resource turns those principles into examples. The common thread is triangulation: use several kinds of evidence instead of trusting one take-home artefact or an AI detector. [10] A workable programme has two lanes. The open lane permits AI for ambitious creation, iteration, research, collaboration or accessibility, with disclosure, a process log, verification and reflection. The secure lane uses supervised exams, practicals, oral defences, live debugging or observed performances when a programme must assure core knowledge and independent capability. The University of Sydney has made this two-lane logic explicit: open assessments teach students to participate responsibly in an AI-saturated society, while secure assessments validate learning at selected points in the programme. It does not attempt to turn every assignment into a viva, nor does it pretend that every take-home product can be secured. [11] [12] Process + artefact + demonstration + reflection = trustworthy evidence in the age of AI. A three-to-five-minute micro-viva can be attached to a milestone, presentation, laboratory, studio critique, placement or rotating oral sample. The same six questions work across subjects: What problem did you choose? What was your first attempt? Where did AI help, and what did you accept, change or reject? Show me one error. Change one condition: what would you do now? What do you still not know? A balanced rubric might give 20 percent each to problem formulation, domain understanding, and reasoning/verification; 15 percent each to AI judgement and communication; and 10 percent to reflection and transfer. The exact weights can change. The principle cannot: grade the evidence stack, not surface polish. Every open submission should carry a short declaration: "I used [tool] for [role]. I first contributed [question, attempt or plan]. I accepted, changed or rejected [key outputs]. I verified [sources, tests or observations]. My final decision is mine because [reason]. I can explain and reproduce the essential work without the tool." Transparency should be taught as a normal academic practice, not used as a confession booth. Sustainability is more than screen time Calling digital expansion sustainable because it reduces paper or enables distance learning is too shallow. A sustainable AI-enabled education system must pass five tests. Learning lasts. Students retain, explain and transfer more after support is removed.Relationships remain. Teachers, peers, mentors, families and practitioners still supply belonging, challenge, care and ethical context.Access is fair. No essential outcome depends on a premium subscription, high bandwidth, one language, one device or a student's ability to buy private tutoring.Dignity is protected. Sensitive personal, health, family or disciplinary data do not enter unapproved systems; bias and harmful outputs have a reporting route and a human response.Teachers can sustain it. AI removes low-value administrative friction, but the time saved is visibly reinvested in small-group instruction, conferencing, practical supervision and feedback. UNESCO's guidance urges human-centred regulation, data privacy, age-appropriate use and ethical validation. [4] There is also an environmental inference: do not make more compute, devices or data the automatic answer to every classroom problem. Purpose-built tools, low-bandwidth modes, local resources and offline alternatives matter, especially in rural or low-income settings. India already has a policy opening. The National Education Policy 2020 calls for understanding, inquiry, experiential learning and competency-based assessment. CBSE's 2026-27 AI curriculum asks Class IX students to consider bias and access, scope problems, find reliable sources, visualise data and understand generative AI; its Classes 3 to 8 curriculum emphasises problem solving, collaboration, ethics and activity-based learning. [13] [14] The human loop implements these priorities. What institutions can do on Monday A school or university does not need to redesign every subject in one term. It needs one visible, measured success. The first 100 days can begin with five moves: Name the independent capability. Write what the learner must know or do without delegation before selecting a tool.Set the AI role. Classify the task as AI encouraged for low-stakes practice, AI permitted with disclosure, or AI absent or tightly controlled for high-stakes capability checks.Capture a baseline. Let learners attempt a comparable task without AI so later claims are about learning, not just faster completion.Build the human checkpoints. Require a first attempt, process trace, source or test audit, teacher or mentor dialogue and a short demonstration.Measure what survives. Check delayed retrieval, novel transfer, explanation quality, equity, privacy incidents, teacher workload and learner voice. Pause or redesign if output quality rises while unaided capability or wellbeing falls. A REALISTIC MINIMUM GUARANTEE  Every learner receives at least one substantive human conversation at each major learning unit; every high-stakes AI-permitted submission includes a demonstration or defence; and every programme includes delayed or unaided transfer checks. Staffing ratios may vary. The evidence obligation cannot. Leaders should publish the rules in language a fifteen-year-old can understand. Teachers need time to practise hint-first prompts, source checking, micro-vivas and inclusive alternatives. Learners need a safe way to disclose mistakes, while families and communities should know what data are collected and who can challenge a machine-assisted decision. These are the operating system of trust. The final test: when the screen goes dark The future worth building is not a classroom where AI speaks more and people speak less. It is a learning ecosystem where students can access more examples, languages, simulations, feedback and ambitious problems, while teachers, peers, mentors, families and communities remain the source of meaning, challenge, trust and responsibility. The assignment of the future is not a lonely hand-in. It is a small intellectual journey: a question rooted in context; a first attempt that makes thinking visible; an AI interaction that expands what is possible; a human conversation that tests sense; a revision that belongs to the learner; and a new problem that proves whether the learning stuck. The final test is disarmingly simple. After AI has helped, can the learner still think, speak, make, collaborate, care and act responsibly with another human? If yes, AI is serving education. If no, the system has optimised the artefact and undereducated the person. Responsible AI use is therefore not a warning printed at the bottom of an assignment. It is a design choice made at the beginning, a mentoring habit practised in the middle and a human judgement demanded at the end. Sources and further reading This feature expands the supplied reference document AIHumanCollab.docx and integrates current research and guidance available in September 2026. Research findings are context-specific; institutions should reproduce the core tests locally: retention, explanation, verification, transfer, equity and meaningful human contact. [1] OECD Digital Education Outlook 2026: Exploring Effective Uses of Generative AI in Education - OECD synthesis on pedagogical intent, cognitive offloading, teacher agency and equity. [2] AI Competency Framework for Students - UNESCO framework: 12 competencies, four dimensions and Understand-Apply-Create progression. [3] AI Competency Framework for Teachers - UNESCO framework: 15 competencies across five dimensions and Acquire-Deepen-Create progression. [4] Guidance for Generative AI in Education and Research - Human-centred guidance on privacy, age-appropriate use and ethical validation. [5] Generative AI without guardrails can harm learning: Evidence from high school mathematics - Bastani et al., PNAS, 2025; field evidence on unguarded assistance and unaided learning. [6] Active learning increases student performance in science, engineering, and mathematics - Freeman et al., PNAS, 2014; large synthesis of active learning in undergraduate STEM. [7] Retrieval Practice Consistently Benefits Student Learning - Agarwal, Nunes and Blunt, 2021; systematic review of applied classroom research. [8] Tutor CoPilot: A Human-AI Approach for Scaling Real-Time Expertise - Randomized trial with 900 tutors and about 1,800 K-12 students. [9] AI tutoring outperforms in-class active learning: an RCT introducing a novel research-based design - Kestin et al., Scientific Reports, 2025; purpose-built, sequentially scaffolded physics tutor. [10] Assessment reform for the age of artificial intelligence - TEQSA guidance on authentic, fair, transparent and evidence-rich assessment. [11] Program level assessment design and the two-lane approach - University of Sydney model for open AI-supported and secure human-demonstrated assessment. [12] University of Sydney's AI assessment policy: protecting integrity and empowering students - Institutional implementation of the two-lane approach. [13] National Education Policy 2020 - Government of India; inquiry, experiential learning and competency-based education. [14] Artificial Intelligence: Secondary Curriculum 2026-27, Class IX - CBSE learning outcomes on ethics, bias, problem scoping, data sources and generative AI. ...Read more

05 Sep 2026

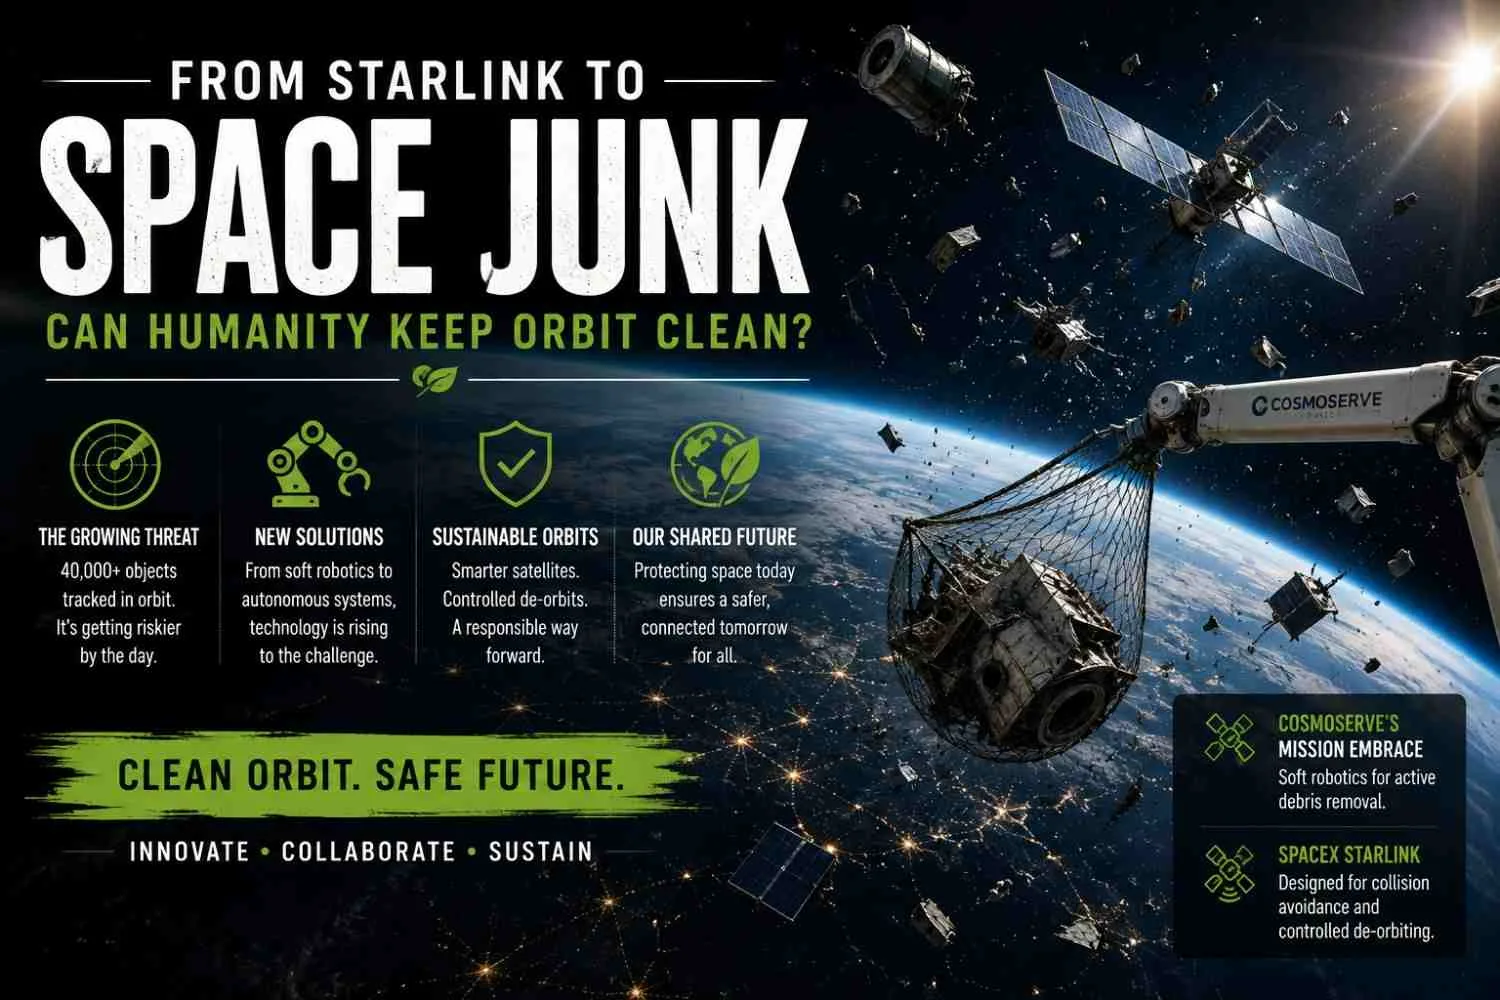
Kolkata | 7 September, 2026 Satellites may be transforming life on Earth, but their afterlife is creating a problem above it. From Cosmoserve’s robotic debris-capture technology to SpaceX’s controlled de-orbiting strategy, new approaches are emerging to keep Earth’s orbital environment sustainable. SummarySpace is no longer an empty frontier. ESA's latest figures show that about 40,000 objects are being tracked in Earth’s orbit, including around 11,000 active payloads, while the actual population of smaller debris is far larger.Cosmoserve Space is approaching the problem from the removal side. Its Mission Embrace is testing soft robotic technology that could eventually help capture inactive satellites and other objects already stranded in the orbit. SpaceX, led by Elon Musk, is approaching it differently: Starlink satellites can adjust their orbits to avoid collisions and are designed to be deliberately de-orbited when they reach the end of their operational life. The two approaches point to the same larger question: Can humanity keep using space without turning its most valuable orbital zones into a dumping ground? But why does space need cleaning in the first place?Every satellite sent into orbit serves a purpose, from communication and navigation to weather forecasting, Earth observation and scientific research. As our reliance on space-based infrastructure grows, so does the amount of hardware orbiting Earth. But when satellites stop functioning, they do not simply disappear and nor do the fragments left behind by previous launches, break-ups and collisions simply disappear. ESA’s 2025 Space Environment Report estimated that around 40,000 objects were being tracked in orbit, of which only about 11,000 were active payloads. The agency also warned that the debris population continues to grow rapidly. The growing number of objects in orbit is only part of the challenge. Their extraordinary speeds make collisions far more dangerous. A collision between two spacecraft or between a satellite and a piece of debris can produce additional fragments, creating new risks for other missions. Those fragments can then trigger further collisions, potentially multiplying the problem. That means orbital debris can continue to become a greater threat even without new satellites being launched.  What counts as space debris?Active satellites Inactive satellites  Rocket remnants Smaller fragmentsCollision-risk zoneSo, what is Cosmoserve actually trying to do?This is where Hyderabad-based Cosmoserve Space enters the picture.  The company is developing Active Debris Removal (ADR) technology, which goes beyond tracking orbital debris to physically capturing objects that are no longer useful. Its Mission Embrace focuses on a soft robotic capture mechanism. Rather than relying solely on conventional docking systems, the technology uses a robotic approach to capture objects in orbit. Cosmoserve has said it took the system from concept to flight-ready hardware in about four months.  But there is an important distinction.  Mission Embrace is a technology demonstration, not proof that Cosmoserve is already removing large quantities of debris from orbit. Its significance lies in testing a technology that could eventually support debris-removal and in-orbit servicing missions. That matters because capturing a defunct satellite is far more complicated than simply locating it.  A servicing spacecraft must identify its target, approach it safely and operate around an object that may no longer be able to communicate, control its movement or manoeuvre away from the approaching spacecraft.  Then what is Elon Musk’s SpaceX doing differently?  SpaceX has built one of the world’s largest satellite constellations through Starlink. As of 27 August 2026, 11,102 Starlink satellites had been launched, with 11,087 reported as operational, according to current tracking data. That scale brings a different sustainability challenge: what happens when thousands of satellites reach the end of their useful lives?  SpaceX’s approach is largely focused on prevention, manoeuvrability and controlled disposal. Starlink satellites are designed with propulsion and manoeuvring capabilities that allow them to adjust their orbits, avoid collisions and eventually descend into the atmosphere. SpaceX’s sustainability documentation states that satellites undergoing de-orbiting retain manoeuvrability and collision-avoidance capabilities during their descent. In 2026, SpaceX also began lowering the orbits of about 4,400 Starlink satellites from approximately 550 km to 480 km. The lower altitude is intended to reduce the amount of time satellites remain in orbit after their operational lives and, in turn, limit long-term debris and collision risks. COMPARISON INFOGRAPHIC  CosmoserveSpaceX / StarlinkDeveloping active debris removalFocuses on satellite life-cycle managementBuilds technology to capture objectsSatellites are designed to manoeuvreTargets inactive or stranded objectsControls its own satellitesSoft robotic capture is a key technologyControlled de-orbiting is a key strategyStill at the technology-development stageAlready operating at constellation scale So, can prevention alone solve the space-junk problem?That is where the difference between preventing new debris and removing existing debris becomes important. SpaceX’s approach can help ensure that its own satellites do not remain in orbit indefinitely after their mission end. But controlled de-orbiting addresses future disposal; it does not remove the older, inactive objects and fragments already circling Earth. That is the gap that active debris-removal companies are trying to address. The challenge is also becoming larger as more satellites are launched. Expanding satellite networks can bring greater connectivity, communication and other services, but they also add more traffic to already crowded orbital regions. In other words, keeping new debris from accumulating is only one part of the solution. The harder question is what to do with the debris that is already there. HOW DO WE KEEP SPACE CLEAN? Design better satellites↓Track objects in orbit↓Avoid collisions↓De-orbit satellites responsibly↓Remove dangerous existing debris Is cleaning space really about Cosmoserve versus Musk?Not quite. The bigger story is not a contest between Cosmoserve and SpaceX. It is whether the space industry can develop a system in which prevention and removal work together to keep Earth’s orbit usable. SpaceX demonstrates what large-scale satellite operators can do when collision avoidance, manoeuvrability and end-of-life disposal are built into a constellation from the beginning. Cosmoserve represents a different but increasingly important need: technology that can deal with objects already left inactive in orbit and potentially difficult to control or remove. Neither approach, on its own, solves the entire space-junk problem. As launches accelerate and more companies enter the space economy, orbital sustainability will depend on several layers working together: better satellite design, accurate tracking, collision avoidance, responsible end-of-life disposal and, where necessary, active removal of high-risk debris. That changes the question at the heart of the space race. It is no longer only about who can launch the most satellites, build the biggest constellation or reach orbit the fastest. It is about who takes responsibility for what happens after those satellites stop working. True space sustainability will not be measured by how much we put into orbit, but by how responsibly we manage what remains there.Primary sources: European Space Agency — Space Environment Report 2025 — Supports the orbital-debris figures, including ~40,000 tracked objects and ~11,000 active payloads, and the need for active debris removal.  ESA Space Debris Environment Statistics — Provides updated 2026 statistics on tracked objects, satellites, debris populations and orbital mass. SpaceX / Starlink — Commitment to Space Sustainability — Supports Starlink’s collision-avoidance, controlled de-orbiting and satellite sustainability approach. SpaceX — Approach to Space Sustainability and Safety — Supports information on satellite manoeuvrability, collision avoidance, low-altitude operation, controlled de-orbiting and design-for-demise.   Cosmoserve / Mission Embrace Cosmoserve Space — Official Website — Supports Cosmoserve’s Active Debris Removal technology, orbital-debris removal mission and its “Reviver”/“Mothercraft” concepts. The New Indian Express — Mission Embrace — Supports the Mission Embrace soft-robotic capture demonstration and its development timeline. Business Standard — Cosmoserve Mission Embrace — Provides additional reporting on the soft robotic capture mechanism and its role in Active Debris Removal. ...Read more

03 Sep 2026

India’s traditional ecological wisdom reveals how communities once read changes in trees, flowers and seasonal cycles as early warnings of environmental stress.  SummaryFor generations, Indian farmers, forest dwellers and indigenous communities observed plants, animals, soils and seasonal changes to understand environmental conditions. The article explores how this knowledge became embedded in local languages, folk sayings and seasonal traditions, using trees such as jamun, mango, mahua, palash, tamarind, neem and bamboo as examples. It explains that while traditional beliefs cannot always be treated as scientifically accurate forecasts, some observations may reflect real biological responses to moisture stress, temperature changes and seasonal shifts. The discussion of bamboo flowering and the Mautam phenomenon shows how traditional observations can sometimes align closely with modern ecological research. The article argues that such knowledge should neither be accepted blindly nor dismissed as folklore, but studied alongside modern science and environmental monitoring. Ultimately, it asks whether India can preserve this biocultural knowledge as a useful way of understanding changing ecosystems. This summer, Indian orchards and fruit markets seem unusually generous. Jamuns are arriving in quantities that many people say they have not witnessed in decades. Mango orchards in several regions have yielded heavily. Only a few weeks ago, forest floors across central India were carpeted with heavenly mahua flowers, while palash transformed entire landscapes into seas of orange-red flames. In rural areas, such abundance is still not viewed merely as a gift of nature, rather It is treated as a deep-rooted message from nature. For centuries, Indian communities practiced what may be called a form of ecological forecasting. Long before satellites, meteorological models, or groundwater monitoring networks, farmers, pastoralists, forest dwellers, and indigenous communities learned to observe subtle changes in plants, animals, soils, and seasonal cycles and interpreted in their own tongue. These observations evolved into a rich body of traditional ecological knowledge through which communities attempted to anticipate droughts, floods, pest outbreaks, and other environmental disruptions. While modern science may not validate every traditional belief, many of these observations emerged from generations of intimate engagement with landscapes. The lexicon of interdependence, encoding how native communities linguistically locate themselves with material cycles of flora, water, and sustenance. The Curious Case of the Jamun  The unprecedented jamun (Syzygium cumini) productivity this year has revived an ethnoecological axiom embedded in the linguistic fabric of eastern Uttar Pradesh and Bihar that encodes an observed ecological pattern.  "Jamun phale aghaay, paani rahe ghataay."   The underlying intuition is intriguing. Whether this saying is universally true is less important than the ecological insight behind it. Language becomes diagnostic, mediating human interpretation of ecological signals, thereby marking the convergence of ecological observation with linguistic codification. Jamun has a tap root system, a deep-rooted tree capable of accessing groundwater reserves deeper beyond the reach of many plants. Traditional observers believed that unusual fruiting reflected changes occurring beneath the surface; forthcoming water stress long before it became visible to people. Modern plant science does not support the notion that trees can predict the future, yet it does show that many species allocate more energy and resources to flowers, fruits, and seeds to increase the likelihood that its lineage will survive difficult conditions.  Moisture stress, temperature anomalies, and changing climatic conditions can influence flowering and fruiting patterns. Botanists refer to related phenomena as mast seeding, stress-induced reproduction, or reproductive allocation under stress. In this sense, trees may not foresee droughts, but they often respond to environmental pressures much before even humans notice them. Mango and the Memory of Dry Winter The same ecological sensitivity is reflected in traditional observations for the national fruit, the mango (Mangifera indica), across India. Across large parts of northern and central India, farmers have long watched the intensity of mango blossom. In Bundelkhand, one still hears the saying,  “Aam ke phool ghane, garmi pade tani seene.” Dense mango flowering often heralds a severe summer. The saying is both a linguistic artifact and an environment instrument. Moreover, this can be interpreted as a case of ecological semiotics, where flora becomes the signifier and the saying acts the interpretive code. Next, Horticultural science offers an interesting parallel. Mango flowering is known to be influenced by dry conditions and moisture stress during preceding months. Thus, what villagers interpreted as a warning may actually have been an observation of the same environmental signals to which the trees themselves were responding. Mahua: The Tribal Calendar Tree  Among forest communities of central India, mahua (Madhuca longifolia) occupies a special place as both a livelihood resource and a seasonal indicator. Elders among Gond, Baiga, and Oraon communities often viewed exceptionally heavy flowering as a sign that nature was preparing for uncertain times. In the tribal heartlands the onomatopoeic phrase ‘Tipr Tapr’is use to describe the distinct sound of sweet mahua flowers raining down onto the forest floor.  Perception among the native population,"when mahua flowers profusely, the earth still remembers its thirst, captures a perception that environmental stress and reproductive abundance are somehow linked. A particularly abundant flowering season often encouraged families to store more produce, reflecting an expectation that difficult times could lie ahead.  Whether scientifically verified or not, the observation emerged from centuries of indigenous community close engagement with local ecosystems. In the same line The tamil saying  Aalai illaa oorukku iluppaip poo charkkarai  captures role of vital food safety net during stress; when primary resources or sweeteners are completely unavailable, the high natural sugar content of the mahua flower saves the community.   Palash and the memory of hot summer The flowering of palash (Butea monosperma), popularly known as the ‘Flame of the Forest’, occupies a similar place in seasonal memory. Across central and east India, the spectacular flowering of palash has long been associated with the arrival of the hottest and driest period of the year.  Palāś phūlā, garmī ā’ī The folk rendering ‘when palash sets the forest aflame, fierce heat follows’, does not predict drought so much as it marks an approaching phase of environmental stress. This environmental shift finds deeper, poetic resonance across neighbouring cultures. Bengali folk memory warns   Polash phutle phagun ashe, porei jyoishther roddur hashe  noting that while the brilliant orange introduces the spring month of Phagun, it serves as an immediate threshold to the cruel summer sun of Jyoishtha. Simultaneously, Odia rural wisdom sounds a visual alarm through the couplet  Palasha bana jalile, nai nala sukhile mapping the fiery ignition of the forest canopy directly to the drying up of local rivers and rivulets. Also, such a proverb becomes a case of environmental semiosis where the forest becomes the sign, fire becomes metaphor, and heat becomes semantic consequence. Such ethnobiological cues helped communities prepare for changing seasonal conditions long before thermometers and weather forecasts became commonplace. Cross-country wisdom Similar ecolaxicon traditions appear far beyond the Hindi-speaking belt, relying on shared community insights rather than strict, word-for-word dictums. In the Telugu region, farmers have long observed that unusually heavy fruiting of tamarind (Tamarindus indica) can precede a difficult summer; drawing on this experience, elders often summarize this intuition through paraphrased concepts like  “Chinta ekkuva kaaste, vesavi kathinam” observing that when tamarind bears excessively, the summer is bound to turn exceptionally severe. In Karnataka, a comparable piece of rural wisdom survives in the shared understanding often paraphrased as  “Hunase tumba bandre, neeru kadime” indicating that an abundant tamarind harvest naturally accompanies a sharp decline in water availability. In both regions, these localized summaries reflect a deep-rooted awareness of the hardy tree's biological survival mechanism, which accelerates seed production under acute environmental stress.  In Gujarat's Saurashtra region, indigenous weather forecasters historically regarded exceptionally heavy fruiting of neem (Azadirachta indica)as a possible indicator of drought, expressed in the saying  "Limdo ghano phale to dukaal pade." When neem fruits heavily, drought may follow. Even jackfruit, one of India's most productive seasonal trees, finds a place in local ecological memory.  In parts of Kerala and the Western Ghats, older farming communities sometimes regarded extraordinarily heavy jackfruit (Artocarpus heterophyllus) seasons as a sign of climatic irregularity, particularly when accompanied by unusual heat or delayed rainfall. Rather than a canonical proverb, these locally circulated expressions show how everyday speech can store ecological observations in compressed form. Bamboo and the Warning  Yet perhaps the most remarkable example comes from the hills of Mizoram. For centuries, Mizo communities feared an event known as Mautam. In the Mizo language, mau means bamboo (Bambusa vulgaris) and tam refers to a devastating period of famine. The term describes the mass flowering of bamboo that occurs roughly every half-century. Traditional knowledge held that bamboo flowering would be followed by food shortages. The association between bamboo productivity and rodent outbreaks appears not only in Northeast India but also in traditional forecasting compilations from western India reflected in Gujarati  "Vans vadhare phale, undar vadhe."  meaning when bamboo thrives unusually, rats increase. For many years, this belief was dismissed as folklore. Scientific research later demonstrated that bamboo flowering produces enormous quantities of seeds, triggering population explosions among rodents. Once the seeds are exhausted, rat populations move into agricultural fields and grain stores, destroying crops and causing widespread hardship.  Language encodes ethnoecological data by incorporating observed correlations between phenology and climatic outcomes into linguistically encoded transmissible knowledge.  The Ecology of Observation What is particularly striking about these diverse traditions is that they were rarely based on a single observation. Farmers and forest communities interpreted plant behaviour alongside changes in groundwater levels, bird migrations, insect activity, wind patterns, and the timing of seasonal events. Together, these formed a decentralized environmental monitoring system refined over generations. Language becomes the medium through which this decentralized system is stabilized and transmitted informally generation after generation . It does not merely record the ecology of observation; it processes, stores, and projects. It documents observation and makes vernacular speech an ecological model across generations. The observations may not always have been accurate, but they reflected a sophisticated understanding that humans are part of larger ecological networks and that environmental change often announces itself through subtle biological signals through plants. Modern science increasingly recognizes that plants are among the most sensitive responders to environmental change. Variations in groundwater, soil moisture, temperature, and seasonal timing can alter flowering and fruiting patterns long before the consequences become visible to people. This does not mean that every bumper crop predicts drought or every profuse flowering foretells crisis. Also, traditional communities noticed this early, and language formed the tool that captured the biological signals. Nature is rarely so simple. Yet it does suggest that traditional communities may have been observing real ecological relationships, even when their explanations differed from those of contemporary science. As India confronts groundwater depletion, intensifying heat waves, erratic monsoons, and growing climate uncertainty, these traditions deserve neither blind acceptance nor casual dismissal. Instead, they invite a fresh look of biocultural architecture where language, environment and people intersect and treasure the repository of our survival. They remind us that landscapes are constantly communicating through the plants, animals, and seasonal rhythms around us in the native lexicon; ecolexicon. The abundance of jamuns, mangoes, mahua flowers, jackfruits, tamarinds, or neem fruits may not provide a precise forecast of the future. But they may still be telling us something important about the environmental stresses unfolding around us. The question is whether we still know how to listen the echoes of nature?ABOUT AUTHOR                                                         Prof. Dr. Kushagra RajendraMobile: 9650913635Head of Dept. UGC-Master Trainer IKS Columnist Environmental & Sustainability -- Amity University Haryana, India   Prof. Devina Krishna (linguist) Dept. of English, Patna Women's CollegeShe mainstreams in language, ecology, and culture.  ...Read more

31 Aug 2026

Kolkata |31 August, 2026 India’s construction boom is creating a narrow window to cut emissions before new commercial and residential buildings lock in decades of energy demand. Green standards, low-carbon materials, efficient cooling and occupant wellness are becoming central to that transition. Summary India’s building sector is expanding rapidly, making construction and building operations an important part of the country’s decarbonisation challenge. Buildings already account for a significant share of India’s electricity demand, while much of the building stock that will exist in the coming decades is yet to be constructed. Green-building frameworks such as IGBC and GRIHA are pushing developers towards better energy, water, material and indoor-environment performance. BEE has also strengthened the policy framework through the Energy Conservation and Sustainable Building Code 2024 and Eco Niwas Samhita 2024. But certification alone cannot prove that a building is genuinely low-carbon. The bigger test is whether developers reduce embodied carbon in materials, improve HVAC performance, lower actual energy use and deliver measurable benefits for occupants after the building becomes operational. Can India’s real-estate boom become a decarbonisation opportunity instead of an emissions trap?India is entering a major phase of construction, with new offices, homes, hotels, hospitals and commercial developments expanding across its cities. Every building project makes decisions that can shape energy demand, cooling needs, material use and water consumption for decades. That creates both a challenge and an opportunity. A poorly designed building can lock in high energy consumption long after construction is complete. A well-designed one can reduce that demand from the outset through passive design, energy-efficient systems, lower-carbon materials and renewable energy. This is why the net-zero real-estate conversation is moving beyond visible measures such as solar panels and efficient lighting. The bigger question is how a building is designed, what materials go into it, how efficiently it operates and whether the people inside it actually experience healthier and more comfortable conditions. In other words, decarbonising real estate is not just about making buildings consume less electricity. It is about reducing their environmental footprint from construction and material choices through everyday operation and occupant wellbeing.   WHERE A BUILDING’S CARBON COMES FROM CONSTRUCTION Cement + steel + glass + transport↓ EMBODIED CARBON OPERATION Electricity + cooling + lighting + equipment↓ OPERATIONAL CARBON OCCUPANCY Thermal comfort + daylight + ventilation + indoor air quality↓ OCCUPANT WELLNESS NET-ZERO BUILDING Materials + energy + people + performance   Are green-building certifications enough to prove that a building is genuinely sustainable?India has developed two major voluntary green-building frameworks: the Indian Green Building Council (IGBC) and the GRIHA Council. Both assess buildings against a range of sustainability criteria, although their rating systems and approaches are not identical. IGBC offers rating systems for areas including new buildings, homes and net-zero buildings, while GRIHA evaluates factors such as energy and water use, materials, waste management, site planning and occupant-related performance. But certification should not be treated as simply a green label. It can demonstrate that a project has met a defined set of sustainability criteria. The harder test comes after the building is occupied.Does it perform as promised when it is put to real-world use?A developer may secure certification during the design or construction stage, but the building's real energy and resource performance becomes clearer only after it begins operating. Actual occupancy, cooling demand, equipment use and maintenance can all affect its performance. That makes the evidence behind the claim just as important as the certification itself. A credible assessment should establish the baseline, the performance target, the methodology used and the comparison point. It should also show how much energy the building actually consumes per square metre and whether that performance continues to be monitored after certification. This distinction becomes even more important for net-zero claims. A building may perform efficiently during operation, but its overall environmental footprint also depends on factors such as the materials used in construction and the emissions associated with producing and transporting them. Certification can show that a building meets a standard. Long-term performance data is what shows whether that standard translates into real-world sustainability.Can green cement and recycled steel cut the carbon hidden inside construction? Operational energy is only one part of a building’s carbon footprint. A building may use relatively little electricity once it is occupied and still carry significant emissions from the materials used to construct it. Those emissions are generated before the building is even ready for use, through activities such as mining, processing, manufacturing and transportation. This is why cement and steel are at the centre of the embodied-carbon debate. Developers and material manufacturers are increasingly exploring lower-carbon cement, alternative binders, recycled steel and more efficient use of construction materials to reduce emissions at this stage. But calling a material “green” is not enough. The real test is what changed compared with the conventional alternative. What material was replaced? What was its original carbon intensity? How much recycled content was actually used? Where was the material sourced from? What lifecycle boundary was used to calculate the reduction? And how much carbon was genuinely avoided? Without a clear baseline and reporting methodology, a percentage reduction can sound impressive while providing little information about its actual environmental impact. For a credible net-zero building claim, material-level emissions need to be traceable across the project's defined reporting boundary - from sourcing and manufacturing through construction and, where relevant, the building's future lifecycle. The goal is not simply to use greener materials. It is to prove how much carbon those choices actually prevent from entering the atmosphere.  THE EMBODIED-CARBON CHECKCONVENTIONAL MATERIAL Cement / steel↓BASELINE CARBON LOWER-CARBON MATERIAL Green cement / recycled steel↓ACTUAL CARBON ↓ MEASURED MATERIAL SAVING Baseline − Actual = Reduction Add: recycled content + source + lifecycle boundary + quantity used   Could HVAC design become the biggest operational test for green buildings?For India, cooling cannot be treated as an afterthought. As temperatures rise and air-conditioning becomes increasingly important across offices, homes, hospitals and commercial buildings, the way a building manages heat can have a major impact on both energy use and emissions. The Bureau of Energy Efficiency (BEE) building-efficiency framework covers areas including mechanical systems, HVAC, building envelopes, lighting, electrical systems and renewable energy. The Eco Niwas Samhita 2024 also focuses on residential building-envelope performance, with measures aimed at reducing heat gain while improving natural ventilation and daylighting. The logic is simple: a building that absorbs more heat needs more cooling, more cooling requires more electricity, and where electricity remains carbon-intensive, higher demand can mean higher operating emissions. That is why efficient HVAC systems cannot work in isolation. They need to be combined with insulation, shading, appropriate glazing, building orientation, ventilation and better envelope design. The more important question is therefore not simply: How efficient is the air-conditioner? It is: Why does the building need so much cooling in the first place?Building codes also play a crucial role. BEE's energy-efficiency standards provide a national framework, while state urban-development departments and local building authorities influence approvals, enforcement and implementation. MoHUA's urban-building policy framework and local development rules can further determine how sustainability requirements are translated into actual projects. This creates a potential implementation gap. A strong national standard can deliver limited results if compliance and enforcement remain weak at the city or project level.Does a green building still work if its occupants are uncomfortable?  This is where the human side of green construction becomes impossible to ignore. A building may report lower energy consumption while its occupants continue to experience excessive heat, poor ventilation, glare, noise or indoor-air-quality problems. Lower energy use alone therefore cannot determine whether a building is genuinely performing well. Occupant wellness needs to be treated as an outcome, not an optional feature added to a sustainability checklist. For offices, hotels, hospitals and residential buildings, relevant indicators can include: Thermal comfortIndoor air qualityDaylight accessVentilationAcoustic comfortOccupant satisfactionAccess to natural light and outdoor spaces The evidence should come from the people using the building as well as from its building-management systems. A developer's sustainability report can show energy consumption and technical performance. Occupant surveys can reveal whether those improvements actually translate into a building that is comfortable, healthy and functional for the people inside it. A building cannot be considered truly green if it saves energy on paper but compromises the people who have to live or work inside it. THE GREEN-BUILDING SCORECARD  AreaWhat should be measured?EnergykWh/m²/yearCarbonAbsolute + intensity emissionsMaterialsEmbodied carbonCementCarbon intensity + alternativesSteelRecycled content + lifecycle impactHVACEnergy performance + cooling demandWaterConsumption + reuseOccupantsComfort + air quality + satisfactionCertificationRating + post-occupancy performanceInvestmentBudget/capex + actual spendingContinuityPerformance after handover   Is India's building policy moving fast enough to match the construction boom?India already has a growing policy framework aimed at improving building efficiency and sustainability. The Energy Conservation and Sustainable Building Code 2024 and Eco Niwas Samhita 2024 provide updated approaches to energy performance and sustainable building design, while BEE also operates a voluntary star-rating programme for commercial buildings based on their actual energy performance. But a standard has value only when it moves from policy documents into real buildings. That means looking beyond whether developers have adopted a requirement on paper and examining whether it is followed through design, construction and everyday operation. State urban-development departments, municipal corporations and local building authorities also have an important role in approvals, development rules, implementation and enforcement, particularly where voluntary green-building standards overlap with mandatory regulations. The evidence should therefore separate five very different milestones: a target announced, a design approved, a certification obtained, a building completed and a building actually performing as promised. These milestones are not interchangeable, and treating them as one can make a project appear further ahead than it really is.What happens when green buildings cost more upfront? Cost remains one of the strongest arguments against more aggressive green-building requirements. Energy-efficient building envelopes, advanced HVAC systems, lower-carbon materials, smart controls and renewable-energy installations can all require greater upfront investment. That can encourage developers to prioritise measures with faster financial returns. But the calculation looks different when a building is assessed across its full operating life. Higher initial investment can potentially reduce electricity consumption, cooling requirements and maintenance costs over time. The better question is therefore not simply how much a green building costs to construct, but what environmental and financial outcomes that additional investment produces? A credible assessment should ask: How much additional capital expenditure was required? How much energy was saved? How much did annual operating costs fall? What was the payback period? And did the building continue to deliver those savings after handover? The money itself also needs to be traceable. A large sustainability commitment announced in an annual report is not the same as money actually spent on a completed project.Can India's developers move from green certification to genuine net-zero performance?Ultimately, the answer will depend on what the sector chooses to measure and disclose. The strongest projects will not stop at reporting the number of green-certified buildings. They will show baseline energy use, actual energy intensity, embodied-carbon calculations, renewable-energy generation, water consumption, occupant outcomes, capital expenditure and post-occupancy performance. The comparison point matters just as much. A claim that a building uses 30% less energy may sound significant, but 30% less than what? Was it compared with a conventional code-compliant building? An earlier version of the same project? Or a comparable building operating in the same climate? Without a credible baseline, even a large percentage reduction can be difficult to interpret. Net-zero performance is ultimately about measurable change, not simply the presence of a green label or the size of a sustainability claim.   ANNOUNCEMENT VS OUTCOME GREEN TARGET ANNOUNCED ↓ DESIGN ↓ CONSTRUCTION ↓ CERTIFICATION ↓ OCCUPANCY ↓ ACTUAL PERFORMANCE Energy ↓ | Carbon ↓ | Cooling demand ↓ | Water ↓ | Comfort ↑ The real green-building story begins after the ribbon-cutting.   So, can India's real estate sector decarbonise before the grid does?It can reduce a significant part of the demand it places on the grid. But “net-zero” requires more than efficient equipment or a green certification. It requires a clear boundary around emissions, credible assumptions, measurable reductions and transparency about renewable energy and any offset reliance. The first priority should be reducing demand. That means designing buildings that need less cooling, using efficient systems, reducing material emissions and improving water and resource efficiency. Renewable energy can then address part of the remaining electricity demand. Offsets, where used, should be clearly separated from actual emissions reductions. The strongest net-zero building is therefore not the one with the most impressive sustainability label. It is the one that can show what its baseline was, what changed, how much it cost, what occupants experienced and whether the performance continued after the project was completed. THE REAL NET-ZERO BUILDING TEST Build less carbon into the structure.Use less energy to operate it.Cool it intelligently.Measure what occupants experience.Follow the money.Report actual performance.Keep measuring after certification. India's construction boom is creating a narrow window. What gets built today will shape the country's energy demand for decades. The question is no longer whether India can build greener buildings. It is whether it can prove that those buildings stay green once people move in.   Sources:  Bureau of Energy Efficiency (BEE) — Energy Conservation and Sustainable Building Code 2024 (ECSBC 2024)Useful for: commercial/office building energy-efficiency requirements, building envelope, HVAC, lighting, electrical systems and sustainable-building provisions. BEE — ECSBC 2024 BEE — Eco-Niwas Samhita 2024Useful for: residential building energy performance, building-envelope requirements, heat gains, daylight and natural ventilation. BEE lists the 2024 ENS among its current building-efficiency resources. BEE — Eco-Niwas Samhita 2024 BEE — Building Energy Efficiency / Energy Efficiency ResourcesUseful for: India's building-sector energy-efficiency framework, commercial-building performance and retrofit/cooling resources. BEE — Building Energy Efficiency Resources Indian Green Building Council (IGBC) — Green New Buildings Rating SystemUseful for: IGBC certification, energy efficiency, water conservation, building materials, indoor environmental quality, certification levels and the transition to Version 4.0 from May 2026. IGBC — Green New Buildings IGBC — Net Zero Carbon RatingThis is especially important for your article. It supports the distinction between design/construction-stage and operations-stage certification, embodied-carbon requirements and operational-carbon requirements. It also states that the certification is valid for three years, reinforcing your argument that performance needs to be monitored rather than treated as a permanent achievement. IGBC — Net Zero Carbon Rating IGBC — Green Existing Buildings Rating SystemUseful for: operational performance, mandatory energy/water/fresh-air requirements, certification review and the importance of final documentation rather than relying only on anticipated performance. IGBC — Green Existing Buildings IGBC — Green Homes Rating SystemUseful for: the residential side of your story and current Green Homes Version 3.0 framework. IGBC — Green Homes ...Read more

27 Aug 2026

Kolkata | 27 August, 2026  India is electrifying its railway network while metro systems are adding solar power, renewable procurement and energy-efficiency measures. But as passenger numbers rise, the next challenge is deeper: making the electricity, stations and first- and last-mile connections cleaner without confusing infrastructure announcements with actual emissions cuts. SummaryIndia's railway and metro systems are undergoing a major energy transition. Indian Railways had electrified 99.6% of its broad-gauge network by July 2026, while about 1,161 MW of solar and 103 MW of wind capacity had been commissioned by June 2026. Railway electrification has also sharply reduced diesel use for traction. Delhi Metro is increasing its renewable-energy use while passenger demand continues to grow. Kolkata Metro offers another lesson through energy-efficiency improvements alongside expanding ridership. The transition therefore cannot be judged only by kilometres electrified, solar capacity installed or green-station certifications. The stronger test is whether renewable electricity is actually being used, energy consumption per passenger falls, emissions decline within a clearly defined boundary and investments deliver measurable results. Can India’s railway system go green as fast as it electrifies?  For decades, diesel locomotives were a visible part of India’s railway emissions story. Electrification has changed that equation dramatically. Indian Railways has pushed electrification at an exceptional pace. By July 2026, Indian Railways had electrified 99.6% of its broad-gauge network, with only a small portion yet to be electrified. Between 2014 and 2026, around 48,072 route kilometres were electrified, compared with roughly 21,801 kilometres during the six decades before 2014. The transition has also reduced diesel use for railway traction. Indian Railways reported that traction-related diesel consumption fell from 293 crore litres in 2015-16 to 108 crore litres in 2024 - 25.That represents a major operational shift. But electrification raises the next question: What powers the electricity? Switching from diesel to electric locomotives reduces direct emissions, but the overall climate benefit also depends on the source of the electricity used to power them. Electrification therefore removes one major source of direct emissions, but it does not automatically make the railway system renewable or zero-carbon.That makes renewable energy the next stage of the transition. Indian Railways reported that, as of June 2026, around 1,161 MW of solar capacity and 103 MW of wind capacity had been commissioned. The solar capacity includes both rooftop and land-based projects.The numbers show that the railway’s transition is moving beyond simply replacing diesel with electricity. The next challenge is to make more of that electricity cleaner - and to measure how much renewable power actually contributes to the railway’s overall energy demand and emissions reduction. THE ELECTRIC RAILWAY TEST  DIESEL TRACTION↓RAILWAY ELECTRIFICATION↓HIGHER ELECTRICITY DEMAND↓RENEWABLE POWER↓ACTUAL CLEAN ELECTRICITY USED↓LOWER EMISSIONS PER JOURNEY Electrification is the transition. Cleaning the electricity is the deeper decarbonisation test. Can railway stations become power producers instead of just power consumers?Railway stations offer a natural opportunity for solarisation. Their rooftops, parking areas and other available spaces can support solar installations, allowing electricity to be used at the station or integrated into wider railway operations. The scale of this effort has grown rapidly. In November 2025, Indian Railways reported 898 MW of commissioned solar capacity across 2,626 railway stations. Around 629 MW was intended for traction, while the remaining capacity supported non-traction requirements such as stations, workshops, service buildings and railway quarters.That figure, however, should now be treated as a milestone rather than the latest national total. By June 2026, Indian Railways reported around 1,161 MW of commissioned solar capacity.Installed capacity alone does not tell the full story. What matters is how much renewable electricity is actually generated and used. A stronger assessment would therefore ask:•    How much electricity is the solar capacity actually generating?•    How much is being used for railway operations?•    How much is supporting traction?•    When was each plant commissioned?•    What was the capital cost?•    What is its expected operating life?•    How is its performance being monitored?•    What happens to the equipment at the end of its useful life? A station covered in solar panels may look green. Renewable capacity is only part of the picture. A station that can demonstrate actual clean-energy generation, consumption and emissions avoided offers stronger evidence of meaningful decarbonisation. What happens when more passengers choose greener transport? This is where the story becomes more complicated. A public transport system can become more efficient even as its overall electricity consumption rises. Higher energy use does not necessarily mean that the system is becoming less efficient.If more people choose a metro instead of private vehicles, the system may consume more electricity overall while producing lower emissions per passenger journey. Delhi Metro provides a useful example. DMRC’s 2025 energy case study reported that solar power contributed 32% of its total energy consumption during the period assessed. The system has also used renewable electricity procurement to reduce its dependence on conventional power.Passenger demand has also grown, with Delhi Metro recording 235.8 crore passenger journeys in 2025 compared with 223.5 crore a year earlier. The figures highlight why electricity use needs to be assessed alongside passenger demand. If ridership grows faster than energy demand, the system may become more efficient. Even if total electricity consumption increases, a decline in energy use per passenger journey can indicate improved efficiency. But if both absolute electricity consumption and emissions continue to rise, a higher renewable-energy share alone does not tell the complete story. The real measure of a greener public transport system is therefore not simply how much renewable energy it uses, but whether it can move more people with a lower environmental cost per journey. ENERGY SAVINGS VS RIDERSHIP RENEWABLE SHARE ↑RIDERSHIP ↑ENERGY EFFICIENCY ↑↓CHECKTotal energy useEnergy per passengerCarbon per passengerAbsolute emissions A greener network should be measured against the people it moves, not only the infrastructure it installs. Can Kolkata Metro cut emissions by using less electricity in the first place?Kolkata Metro offers a different lesson in decarbonisation: sometimes the cleanest unit of electricity is the one the system does not need to consume.The transition does not always require a new renewable-energy plant. Improving the efficiency of existing infrastructure can also reduce energy use and emissions.Metro Railway Kolkata has been replacing its older steel third rail with a more conductive aluminium third-rail system. The railway has stated that the upgrade can reduce energy losses by 84% on the affected system, while also reducing voltage drops and improving operational efficiency. The project highlights a simple but important principle:Electricity generated from clean sources is still wasted if it is unnecessarily lost before reaching the system that needs it. That makes energy efficiency an important part of railway and metro decarbonisation. More efficient traction systems, regenerative braking, better station cooling, energy-efficient lighting and improved energy management can all complement renewable-energy procurement. Kolkata also demonstrates why ridership needs to be part of the climate discussion.After the Green Line became fully operational in August 2025, daily ridership rose from around 78,000 to 2.04 lakh.More passengers can naturally increase a metro system’s electricity demand. But that does not automatically mean its environmental performance is worsening. If those additional passengers are shifting from private cars, motorcycles or other more carbon-intensive modes, the wider transport system could still be reducing emissions. Can a Metro Be Truly Green If Passengers Still Depend on Cars to Reach It? A metro journey does not begin when a passenger enters the station.It begins at home.That makes first- and last-mile connectivity an important part of the decarbonisation story. A passenger who walks, cycles or uses an electric feeder to reach a metro station has a very different emissions profile from someone who drives a petrol or diesel vehicle to the station. A metro’s climate benefit does not depend only on the train journey. How passengers get to and from the station matters just as much. A low-carbon metro cannot be judged only by what happens on the tracks. The entire passenger journey has to be considered. That means the transition needs to connect: Homes → Feeder transport → Metro/Railway → Feeder transport → Destination Electric buses, e-rickshaws, shared mobility, cycling infrastructure and safe pedestrian routes can extend the climate benefits of mass transit beyond the station gates. This means metro corporations need to look beyond the electricity used to run their trains. The wider question is whether the transport network makes it easy for passengers to complete their entire journey through low-emission modes. The key question is:Are metro systems making it easier for people to reach and leave stations without having to fall back on high-emission private transport?A metro may run on clean electricity, but its full environmental benefit is limited if passengers still need petrol or diesel vehicles to complete the first and last mile. THE LOW-CARBON JOURNEY HOME↓🚶 WALK / CYCLEor⚡ ELECTRIC FEEDER↓🚇 METRO / RAILWAY↓🚶 WALK / CYCLEor⚡ ELECTRIC FEEDER↓DESTINATION The train can be green. The entire journey needs to move in the same direction. Does a green railway-station certificate prove that a station is sustainable? Not by itself.Green-building and green-station certifications can provide a useful framework for improving a station’s performance across areas such as energy efficiency, renewable energy, water conservation and waste management. The IGBC Green Railway Stations rating system, for example, covers several of these areas and can help guide stations towards more sustainable design and operations.But certification and actual environmental performance are not the same thing. A stronger evidence test should ask:What was the baseline? What did the reporting boundary include? Which measures were actually commissioned? How much energy is being saved? How much water is being conserved or reused? What was budgeted, and how much was actually spent? Are the claimed savings still being measured after implementation? These questions matter because a green rating can demonstrate that specific sustainability measures have been incorporated into a project. It does not automatically prove that the station is delivering the same level of long-term carbon reduction in its day-to-day operations. Ultimately, a certificate can show what a station was designed or assessed to achieve. Actual performance data shows what it is achieving in practice. Beyond Electrification: How Green Is the Railway? THE GREEN TRANSIT SCORECARD EvidenceWhat should be measuredElectrificationRoute kilometres + commissioning dateSolarInstalled MW + actual generationWindInstalled MW + actual generationTractionRenewable electricity actually usedStationsSolar coverage + electricity consumptionEfficiencyEnergy saved + energy intensityRidershipPassenger journeys + passenger-kmEmissionsAbsolute + intensity emissionsFirst/last mileEV and public-transport connectivityCertificationBaseline + reporting boundary + performanceInvestmentBudget/capex + money actually spentOffsetsQuantity, type and relianceLifecycleConstruction, equipment and end-of-life impacts This is where corporate and government reporting needs to become much more transparent. A company supplying renewable-energy infrastructure should clearly distinguish between capacity that has been announced, installed and actually commissioned. A railway authority should separate electricity generated from electricity actually consumed. A metro corporation should demonstrate whether renewable-energy procurement is translating into measurable changes in its emissions profile. Similarly, green-station certification should be treated as one part of the sustainability assessment, not a substitute for measuring the station’s wider emissions and resource use. The distinction may sound technical, but it determines whether sustainability claims reflect what is actually happening on the ground. Can the world’s largest passenger railway network decarbonise without compromising access? There is no single technology that can answer that question. Electrification is essential, but it is only the first layer of the transition. Solar and wind power can reduce the carbon intensity of railway electricity. More efficient traction systems can reduce energy losses. Greener stations can lower energy and water demand. Metro expansion can shift passengers away from private vehicles. Electric buses and feeders can connect neighbourhoods to mass transit while keeping the wider journey cleaner. Together, these measures can move the railway and public-transport system towards lower emissions without making access to mobility more difficult. But every layer creates a new measurement challenge.The sector needs to distinguish between announced and commissioned projects, installed capacity and actual generation, renewable-energy procurement and actual renewable-energy consumption, and energy savings and measurable emissions reductions. It also needs to account for the lifecycle footprint of new tracks, stations, trains, solar equipment and other infrastructure, rather than measuring only the emissions produced during day-to-day operations. The goal is not simply to build a railway that uses more clean technology. It is to build a transport system that can demonstrate, with evidence, that it is moving more people while reducing the environmental cost of that mobility. THE REAL DECARBONISATION TEST  ELECTRIFY↓POWER WITH RENEWABLES↓REDUCE ENERGY LOSSES↓GROW RIDERSHIP↓CONNECT FIRST & LAST MILE↓MEASURE EMISSIONS PER PASSENGER↓VERIFY SPENDING & PERFORMANCE  India’s Railways Are Going Electric. But Are They Truly Low-Carbon? The evidence points to a major transition - but not a finished one.Indian Railways has reached 99.6% broad-gauge electrification, while its latest reported renewable-energy capacity stood at 1,161 MW of solar and 103 MW of wind commissioned by June 2026. Traction-related diesel consumption has also fallen substantially over the past decade. These are significant milestones. But electrification is not the finish line. It is the foundation for the next stage of decarbonisation. The harder task now is to clean the electricity powering the network, reduce energy losses, expand public-transport use and make the entire passenger journey lower-carbon - from the first mile to the last. For Indian Railways and the country’s expanding metro systems, the strongest sustainability claim will therefore not simply be:“We electrified the railway.”It will be:“We can show how much cleaner each journey has become - where the electricity came from, how much energy and carbon were actually saved, what was spent and what changed on the ground.” That means moving beyond headline numbers and proving the difference between infrastructure installed and performance achieved. Because a railway does not become truly green simply because its locomotives run on electricity. Electrifying the railway is a major step. But it is not the finish line. The transition becomes truly green when the electricity gets cleaner, energy losses fall, more people choose mass transit, and emissions per journey show a measurable decline.That is what India’s green rail transition must ultimately prove: not simply that more tracks are electrified, but that every step is making the country’s mobility cleaner and lower-carbon.  Sources: Indian Railways / Ministry of Railways — Railway Electrification & Renewable Energy, July 2026Supports the latest 99.6% broad-gauge electrification, the 1,161 MW solar + 103 MW wind commissioned by June 2026, and the fall in traction diesel consumption from 293 crore litres in 2015-16 to 108 crore litres in 2024-25. Ministry of Railways — Railway Electrification & Renewable Energy Indian Green Building Council — Green Railway Stations Rating SystemSupports the sections on green-station certification, energy and water savings, renewable energy, waste management and first-/last-mile connectivity. It also explains the performance-improvement study and third-party assessment process. IGBC Green Railway Stations Rating System Indian Green Building Council — Green High Speed Rail Rating SystemUseful for the broader low-carbon rail infrastructure, lifecycle/site boundary and first-/last-mile connectivity discussion. IGBC Green High Speed Rail Rating System Indian Railways — Renewable Energy / Solarisation milestonesUse this for the earlier 898 MW solar capacity across 2,626 stations milestone that appears in the article as historical context. For the latest figure, use the July 2026 Ministry of Railways release above. Delhi Metro Rail Corporation — Sustainability / Energy documentationThis is the source to retain for the Delhi Metro solar contribution, renewable procurement, energy efficiency and ridership portions. The official DMRC site is also the appropriate primary source for its operational and sustainability documentation. Delhi Metro Rail Corporation ...Read more

27 Aug 2026

Kolkata | 27 August, 2026   India’s higher-education campuses are becoming living laboratories for solar power, green buildings, waste reduction and water conservation, while their net-zero ambitions face a harder test from carbon-intensive grids, ageing infrastructure and rising student demand. SummaryIndian IITs, IIMs and universities are increasingly incorporating renewable energy, green buildings, energy-efficient infrastructure, waste management and water conservation into campus planning. Rooftop solar can reduce dependence on grid electricity, while retrofits can make hostels, classrooms and laboratories more efficient. Campuses can also reduce emissions through wastewater reuse, rainwater harvesting, waste segregation and better cooling systems. But a green campus is not automatically a low-carbon campus. A university must account for electricity purchased from, the grid, construction and renovation emissions, transport, water and waste systems, and the growing energy demand of laboratories, data infrastructure and air-conditioning. Students can add another layer of accountability by independently tracking whether sustainability promises translate into measurable outcomes. The real test is therefore not how many solar panels or recycling bins a campus installs, but whether its absolute emissions fall, its energy intensity improves, its investments deliver measurable outcomes and its sustainability systems continue after the initial funding cycle ends. Can a university really become greener while depending on a carbon-intensive grid?A university campus can look remarkably green from the outside. Solar panels may cover rooftops, new academic buildings may carry green-building certifications, waste may be segregated, rainwater may be harvested and students may cycle across campus instead of using cars. But these visible changes only tell part of the story.Where does the campus actually get its electricity from?Rooftop solar can reduce the amount of electricity a university buys from the grid, but most large campuses cannot rely entirely on solar power throughout the day or across every season. Laboratories, hostels, libraries, computer centres and air-conditioned classrooms can require a steady supply of electricity for long hours. This creates the central challenge of the green-campus transition. A university can reduce its dependence on grid electricity without becoming independent of it. The challenge becomes even greater as campuses expand. More cooling, digital infrastructure, research equipment and other energy-intensive facilities can push electricity demand higher, meaning that energy efficiency gains do not necessarily translate into lower overall emissions. The real test is therefore not how green a campus looks, but whether it is reducing its carbon footprint as its energy needs continue to grow. THE CAMPUS CARBON EQUATION Grid Electricity•    Campus Fuel•    Buildings & Construction•    Transport•    Water & Waste         ↓TOTAL CAMPUS FOOTPRINTSolar + Efficiency + Circular Systems          ↓EMISSIONS REDUCTION  The real test: Does the total footprint actually fall?   Are rooftop solar panels cutting emissions - or simply cutting electricity bills?Solar panels have become one of the most visible signs of a green campus. For universities, rooftop solar can deliver two benefits at the same time: lower electricity costs and lower emissions from grid power. But the number of panels installed does not, by itself, show environmental progress. A university can announce a large solar project and still rely heavily on grid electricity if the installed capacity is not fully operational or generation remains limited. The more meaningful questions are: How much solar capacity is actually operational? How much electricity does it generate each year? What share of the campus’s total electricity demand does it meet? How much grid power has it replaced? How much was invested? What is the expected payback period? And what will happen to the panels when they reach the end of their useful life? These questions become particularly important for IITs, IIMs and other institutions making carbon-neutrality or net-zero commitments. A megawatt of installed solar capacity is an activity. The electricity actually generated and the emissions demonstrably avoided are the outcomes that matter.Can old hostels become greener without rebuilding them? India’s university campuses also have a major opportunity in the buildings they already have. Many hostels, lecture halls, laboratories and administrative blocks were constructed decades ago, before energy efficiency became a central part of building design. Retrofitting these buildings can therefore deliver significant improvements without requiring complete reconstruction. Measures can include LED lighting, energy-efficient air-conditioning, building-management systems, insulation, improved windows, smart electricity controls, solar water heating, efficient pumps and better ventilation. Organisations such as IGBC and GRIHA Council have helped establish frameworks for improving the environmental performance of buildings. But achieving a green-building certification should not become the end goal. A building may receive a green rating because it meets specified design and construction requirements. How it actually performs once students, faculty and staff occupy it - is a separate question. For universities, the stronger test is simple: how much energy did the building consume before the retrofit, and how much does it consume afterwards? That comparison shows whether a green upgrade is delivering measurable energy savings rather than simply a greener label. THE GREEN-BUILDING TESTBEFORE RETROFIT Energy useWater useCooling demandMaintenance cost ↓ RETROFIT SolarEfficient coolingInsulationLightingSmart controls ↓ AFTER RETROFITEnergy saved?Water saved?Emissions reduced?Operating cost reduced? Certification shows design intent. Performance data shows what actually happened.   What happens to the waste and water a campus produces?Decarbonisation does not begin and end with electricity. A university campus functions much like a small city, with thousands of students, faculty members and staff using classrooms, hostels, laboratories, kitchens, cafeterias and other facilities every day. All of these activities create environmental pressures beyond energy use. Campuses generate solid waste, food waste, wastewater and other forms of resource demand that need to be managed alongside their carbon footprint. A campus cannot claim to be truly sustainable simply because its rooftops carry solar panels if its waste is poorly managed or its wastewater systems are inadequate. The green-campus question therefore extends beyond where electricity comes from to what happens to the resources and waste flowing through the campus every day. A serious green-campus strategy therefore needs to consider: Waste → segregation → recovery → recycling → residual disposal and Freshwater → consumption → wastewater → treatment → reuseRainwater harvesting can help reduce dependence on freshwater sources, while treated wastewater can be reused for landscaping, toilet flushing and other non-potable needs. Food waste can also be composted or sent through other recovery systems instead of being discarded. But the presence of rainwater tanks, composting units or wastewater-treatment plants does not, by itself, demonstrate environmental progress. Universities should report how much waste they generate, how much is recovered, how much is recycled or composted, and where the remaining waste ultimately goes. Water reporting should be equally transparent. Campuses should disclose freshwater withdrawals, total water consumption, the volume of wastewater treated and how much treated water is actually reused. These figures can give students, administrators and other stakeholders, a much clearer picture of how efficiently a campus uses resources - and where its environmental footprint still remains. Can students become the campus’s sustainability auditors?This could be one of the most valuable opportunities for higher education. Students do not have to remain passive beneficiaries of a greener campus; they can also become part of the system that monitors and questions its environmental performance. Engineering students can track electricity use and solar generation. Management students can examine sustainability budgets and spending. Architecture students can study how buildings perform after green upgrades. Public-health students can monitor indoor temperatures and heat exposure. Environmental studies students can track waste and water use, while journalism students can investigate whether a university’s sustainability claims match what is actually happening on campus. This approach can turn the university into a living laboratory, where sustainability is not just taught in classrooms but observed and tested in the institution itself. However, student participation should complement - not replace - professional auditing. Students can identify gaps, collect observations, analyse data and question institutional claims, while independent technical verification should remain in place wherever specialised assessment or certification is required. The goal is not to turn students into unpaid auditors. It is to give them a meaningful role in making the campus more transparent, measurable and accountable.  STUDENT SUSTAINABILITY AUDIT  ENERGY → Solar generation / grid dependence BUILDINGS → Energy intensity / cooling WATER → Freshwater / reuse WASTE → Generation / recovery / disposal TRANSPORT → Public transport / walking / cycling / EVs PROCUREMENT → Sustainable materials / suppliers ↓ STUDENT AUDIT REPORT Promise → Evidence → Gap → Recommendation   What happens when a green campus keeps expanding?There is another contradiction that net-zero plans need to confront: universities are growing, and growth itself has an environmental cost. New hostels, laboratories, classrooms and research facilities require concrete, steel, glass, cooling systems and other materials. A new green building may use less energy once it is occupied, but its construction still creates emissions and consumes resources. That means campus sustainability cannot be measured only through operational electricity use. Universities need to define a clear reporting boundary that captures the wider environmental impact of their activities. Does the footprint include new construction? Outsourced transport? Staff and student commuting? Purchased electricity? Refrigerants used in cooling systems? Or waste generated by contractors? If these sources are left outside the calculation, a university could report a smaller carbon footprint without addressing the emissions linked to its wider operations. A credible net-zero plan must therefore account for the emissions a university creates—not simply the emissions it chooses to count.Can corporate green-building partnerships create lasting change?  Corporate partnerships can play a useful role in campus decarbonisation. Companies such as Saint-Gobain, building-management firms, developers and other green-building partners can provide energy-efficient materials, cooling systems, building-management technology, solar solutions and retrofit expertise. But corporate involvement also needs to pass the same evidence test as the university’s sustainability claims. Was the intervention funded through CSR or delivered as a commercial project? Who paid for the capital investment? How much did the company contribute? What savings were expected? And who will maintain the system once the project is complete? These distinctions matter because installing a green technology is not the same as delivering a measurable and lasting reduction in emissions. Universities should therefore report the budget, actual expenditure, expected energy or emissions savings and the system’s actual performance after implementation. That makes it possible to distinguish between a partnership that simply delivers new infrastructure and one that produces a measurable environmental improvement.Can a campus measure sustainability without hiding behind percentages?This is where the evidence test becomes crucial. A reported “30% reduction in emissions” may sound impressive, but it does not tell the full story without context. Thirty per cent compared with what baseline? Over which period? Across which buildings? Was campus occupancy higher or lower? Did electricity demand change? Were construction emissions included? And was the reduction measured in absolute emissions or per student? Universities need to disclose their baseline, reporting boundary, methodology and measurement period alongside headline percentages. Absolute figures can show the scale of emissions, while intensity measures - such as emissions per student, per square metre or per unit of electricity consumed - can help compare campuses of different sizes. The same principle should apply to every major sustainability claim: solar generation, water savings, waste recovery, energy efficiency and carbon reductions should be backed by transparent data rather than isolated percentages. A green campus is not defined by the size of its sustainability claims. It is defined by whether those claims can be measured, compared and independently verified. THE GREEN CAMPUS SCORECARD  MeasureWhat should be reported?BeneficiariesStudents, faculty and staff actually coveredEnergyTotal consumption + energy intensitySolarInstalled capacity + actual generationBuildingsPre- and post-retrofit performanceWaterWithdrawal + consumption + reuseWasteTotal generated + recovered + final destinationCarbonAbsolute emissions + emissions intensityInvestmentBudgeted vs actually spentOutcomeActual reduction achievedContinuityWhat remains operational after funding ends A 20% reduction in energy intensity may sound like significant progress. But the more important question is: what happened to the university’s total electricity consumption? If a campus doubles its size while it’s energy use falls slightly per square metre, it’s overall electricity demand could still increase. That is why universities need to report both absolute and intensity-based results. Absolute figures show the total amount of energy or emissions being generated, while intensity measures show how efficiently that energy is being used relative to factors such as floor area or student population. The same principle applies to carbon emissions. Before claiming progress towards net zero, a university should clearly disclose its baseline, measurement methodology and reporting boundary. A lower percentage does not always mean a lower footprint. The numbers need context to show what has actually changed. So, what would a genuinely green campus actually look like?It would not necessarily be the campus with the most solar panels, the most green-building certificates or the longest list of sustainability initiatives. It would be a campus that can clearly account for its environmental footprint. It would know where its energy comes from, how much electricity it consumes, how its buildings perform, how much water it uses, where its waste goes and how its emissions are changing over time. It would consider lifecycle emissions when constructing new buildings instead of treating a green certification as the final measure of sustainability. It would also prioritise retrofitting older infrastructure where improvements can reduce energy and resource use, rather than focusing only on new construction. Water reuse and waste recovery would be measured through actual volumes and outcomes, not simply through the number of treatment plants, collection bins or recycling facilities installed. Students would have the opportunity to examine campus data, question sustainability claims and contribute to monitoring - while independent technical audits would provide verification where needed. And most importantly, sustainability would not depend on one CSR partnership, one university administration or one publicity campaign. A genuinely green campus is one where sustainable practice become part of how the institution operates - and continue to deliver measurable results even when the people, funding and projects behind them change. FROM GREEN CAMPUS TO NET-ZERO CAMPUS  MEASURE↓BASELINE↓REDUCE DEMAND↓RETROFIT BUILDINGS↓ADD RENEWABLE ENERGY↓CIRCULARISE WATER & WASTE↓VERIFY RESULTS↓ CONTINUE AFTER FUNDING   Can a university decarbonise faster than the grid?Yes. A university can reduce its own emissions faster than the wider electricity system changes—but it cannot simply disconnect itself from the grid. That is precisely where the opportunity lies. Universities can become living laboratories for decarbonisation: campuses where students, researchers, administrators and private partners can test technologies, measure results and learn what actually works in the real world. For CSR programmes and institutional sustainability plans, the defining question should therefore not be: “How many solar panels did the campus install?” It should be: “How much energy, water, waste and carbon did the campus actually reduce? How much did it cost? And is that improvement still delivering results?” A credible green campus should be able to show its baseline, account for its spending, disclose both absolute and intensity-based results, and explain what happens when a project or funding cycle ends. Because sustainability cannot be measured by appearances. A campus may have solar panels, green buildings, recycling bins and water-treatment systems and still struggle to reduce its overall footprint if its energy demand keeps rising or its wider emissions remain outside the reporting boundary. The real test is whether the entire campus moves towards lower resource use and lower emissions - and whether the evidence proves that progress. A university does not become sustainable simply when it looks green. It becomes sustainable when its buildings, electricity, water, waste and people move in the same direction - and the numbers can prove it. That is how a campus can become more than a demonstration of sustainability. It can become a model for how decarbonisation actually works.   Primary sources: IIT Delhi — Climate Action Plan & GHG Emission InventoryUseful for its Net Zero 2040 target, Scope 1/2/3 framework, renewable power, rooftop solar and campus sustainability measures. (IIT Delhi)IIT Delhi Climate Action PlanIIT Madras — Climate Action PlanUseful for the campus-wide climate strategy, carbon neutrality, academic buildings, hostels, laboratories, biodiversity and sustainability roadmap. (IIT Madras)IIT Madras Climate Action PlanIIT Madras — Carbon Footprint ReportParticularly important for your evidence-test section because it defines the campus boundary and explains Scope 1 and Scope 2 emissions, including purchased grid electricity. (sustainability.iitm.ac.in)IIT Madras Carbon Footprint ReportIIM Calcutta — Sustainability FrameworkThis is one of the most important sources for your article. It documents IIM Calcutta's Net Zero Campus 2036 target, carbon assessment, renewable expansion, emission reduction, energy/water/waste management and carbon audits. (IIM Calcutta)IIM Calcutta Sustainability FrameworkIIM Calcutta — Campus Transformation / Net-Zero Campus PlanUseful for the academic-block and hostel retrofit/construction angle, including its earlier plan for a Net Zero Energy, Net Zero Discharge and Net Zero Waste campus. (IIM Calcutta)IIM Calcutta Campus Transformation PlanIIT Bombay — Campus Sustainability AssessmentUseful for the campus-as-a-living-lab, sustainability assessment, resource management, student involvement and growing infrastructure-demand angle. (gesh.iitb.ac.in)IIT Bombay Campus Sustainability AssessmentIGBC — Green Campus Rating System, Version 1.0 (January 2026)Very important for your section questioning whether green certification equals actual performance. It explains documentation, third-party assessment, preliminary vs final submissions and implementation evidence required before certification. (IGBC)IGBC Green Campus Rating System 2026GRIHA Council — GRIHA for Existing BuildingsUseful for the green-building retrofit argument. It specifically discusses reducing energy and water demand in existing buildings and the importance of continuous performance monitoring. (GRIHA)GRIHA for Existing BuildingsGRIHA Council — Rated Projects 2025This gives you a concrete campus example: IIT Hyderabad's AD3 project reports a 51.25% reduction in energy performance index from the GRIHA base case, 3.5 MW solar PV, 73% reduction in building water demand and campus-level sewage-treatment infrastructure. (GRIHA)GRIHA Rated Projects 2025Bureau of Energy Efficiency — Energy Conservation Building Code (ECBC)Useful for the energy-efficient building and retrofit section. BEE's material specifically includes educational buildings such as colleges and universities within the building-energy-efficiency framework. (Bee India)BEE — Energy Conservation Building Code materialAssociation of Indian Universities — University NewsUseful for the broader higher-education sustainability framework, including sustainable buildings, reducing energy and water consumption, waste reduction, student/faculty engagement and industry/civil-society collaboration. (Association of Indian Universities)AIU University News — Sustainability in Higher Education ...Read more

25 Aug 2026

Kolkata | 25 August, 2026 India’s fashion industry is experimenting with textile recycling, cleaner production and circular retail models, but the real test is whether discarded clothes actually stay in the material loop - and whether companies can prove where they go. SummaryIndia generates about 70.73 lakh tonnes of textile waste every year, with around 58% coming from post-consumer disposal. At the same time, more than 70% of total textile waste is already being recovered through recycling, reuse, upcycling and downcycling, showing that India has an established recovery ecosystem rather than a complete absence of recycling. The bigger challenge is what happens to clothes after consumers stop wearing them. Garments can be reused, repaired, resold, downcycled or recycled, but blended and damaged textiles can be difficult to recover at their original value. Companies are responding through take-back programmes, recycled fibres, organic cotton sourcing, cleaner dyeing technologies and retail trade-ins. Yet a collection box or sustainability label does not automatically make fashion circular. The stronger test is whether companies can account for the material collected, show an audit trail for its destination, protect the workers handling discarded textiles and demonstrate measurable environmental gains against a clear baseline.   What really happens to a T-shirt after we stop wearing it?For most of the consumers, a garment’s journey seems to end when it is placed in a donation bag, dropped into a collection box or thrown away. For the textile itself, however, that may be only the beginning.A discarded T-shirt can take several different paths. It may be worn again, repaired and resold, converted into wiping cloths or other products, or mechanically recycled into new fibres. But textiles that are heavily damaged, contaminated or made from difficult-to-separate blends can be much harder to recover and may ultimately end up as waste.This is where the idea of a circular fashion economy becomes more complex than simply collecting old clothes. India’s latest government mapping of the textile-waste value chain estimates that the country generates around 70.73 lakh tonnes of textile waste every year. About 42% is pre-consumer waste, generated during manufacturing, while the remaining 58% comes from post-consumer disposal. The study also estimates that more than 70% of total textile waste is already recovered through recycling, upcycling, downcycling or reuse. That changes the way the problem needs to be viewed. India is not starting from zero. A large share of textile waste is already finding its way back into the economy. The bigger challenge is what happens to the remaining material and whether textiles can be collected, sorted and recovered efficiently once they leave the formal manufacturing system. Collecting an old T-shirt does not, by itself, make fashion circular. True circularity begins when the garment has a clear path to its next use. FOLLOW THE FABRICConsumer discards garment↓Collection↓Sorting↓Reuse / Repair → Resale↓Recycling → New Fibre / Product↓Residual Waste → Documented Final Destination  The question: Does every kilogram collected have a documented destination? Can textile collection really make fashion circular?Post-consumer collection is becoming an increasingly visible part of sustainable-fashion efforts. Brands and retailers are encouraging consumers to return unwanted clothes through store collection points, take-back programmes and trade-in schemes. But collection numbers alone can give a misleading picture of circularity. Collecting 10 tonnes of used clothing may sound impressive, but the more important question is what happened to that material after collection.How much was reused? How much was recycled? How much was downcycled? How much was rejected? And where did the rejected material go? This is the difference between collection and actual material recovery.A credible circular-fashion programme therefore needs to maintain a clear mass balance - showing what entered the system, what was recovered, what was converted into another product and what ultimately remained as waste.India’s 2026 government assessment provides an important counterpoint. The country already has a substantial textile-recovery ecosystem, particularly for pre-consumer waste generated during manufacturing. High recovery rates in this segment show that parts of the domestic textile industry already have established systems for collecting and recovering material. The bigger challenge is what happens after a garment leaves the formal manufacturing system and enters the hands of consumers. That is where collection, sorting, logistics and end-market demand become critical to making post-consumer textiles genuinely circular. Is recycling always better than making new clothes?  Not necessarily. The environmental benefit of textile recycling depends on what material is being recycled, which technology is used and what the recovered fibre can replace. Cotton, polyester, nylon and blended fabrics behave differently during recycling. Mechanical recycling, for example, can shorten textile fibres and reduce the quality of the resulting material. More advanced recycling technologies may recover higher-quality fibres from difficult textiles, but they can also require greater investment, energy and specialised infrastructure. This creates an important competing view: Recycling is necessary, but recycling alone cannot solve the problem of overproduction and overconsumption. If brands continue producing large volumes of inexpensive clothing designed for short use, recycling systems may simply end up managing the waste created by a high-consumption model. That is why repair, reuse, resale and longer garment life need to be treated as equally important parts of the circular-fashion system. A garment that is worn for longer, repaired instead of replaced or resold to another consumer can delay the point at which recycling becomes necessary. The goal of circular fashion is therefore not simply to recycle more clothes. It is to keep garments and their materials in productive use for as long as possible. THE CIRCULARITY HIERARCHYLONGER USE↓REPAIR↓REUSE / RESALE↓RECYCLING↓DOWNCYCLING↓DISPOSALKeep the garment in use before breaking it back into material. Can fashion cut its water footprint before a garment even becomes waste?The environmental impact of clothing begins long before a garment reaches the end of its life. Processes such as dyeing and finishing during manufacturing can require significant amounts of water.This has led brands and technology companies to explore waterless and low-water dyeing technologies. Some emerging systems use alternatives such as supercritical carbon dioxide, while others use digital, foam-based or other processes designed to reduce conventional water consumption.The potential benefit is straightforward: using less water for the same production output can reduce pressure on freshwater resources while also lowering the volume of wastewater generated. But the technology still needs to pass an evidence test. A company should not simply state how many litres of water it saves per garment. It should explain what the saving is measured against and what the calculation includes.What exactly does the reported reduction cover? Is it limited to dyeing, or does it include finishing as well? Does the alternative process save water but consume more energy? Has it been proven at commercial scale? And how much has the company actually invested compared with what it originally announced? These questions matter because a technology can look highly efficient in a pilot project but deliver very different results when used across a large manufacturing operation. A water-saving technology becomes meaningful only when its environmental benefits can be demonstrated at commercial scale.Does organic cotton automatically make a garment sustainable?Organic cotton can be part of a lower-impact sourcing strategy, but the label alone cannot tell the complete sustainability story. What matters is how the cotton was produced, verified and traced through the supply chain. Companies need credible certification and traceability systems to establish whether suppliers are meeting the required environmental and production standards. There is also a crucial social question: Who is able to participate in this transition? Who are the farmers producing the cotton? What prices are they receiving? Can small producers afford certification? Who pays for compliance and verification? If sustainable sourcing requirements become too expensive or complicated, smaller farmers may find it harder to participate.Responsible sourcing therefore needs to look at both environmental performance and farmer inclusion. Certification can provide an important layer of verification, but it should be treated as a starting point for scrutiny rather than the final proof that a supply chain is sustainable.Can retail trade-ins actually make fashion more circular?Trade-in programmes are becoming another visible part of the circular-fashion model. Consumers return unwanted clothing to a retailer and receive a discount, store credit or another incentive towards a future purchase. The model can help solve one problem by giving retailers a way to bring used garments back into the system instead of allowing them to disappear into the waste stream. But there is also a potential contradiction. If a trade-in reward simply encourages consumers to buy another garment immediately, the programme could increase consumption rather than reduce it. A truly circular model would prioritise repair, resale and reuse for returned clothing, with recycling serving as the last option.The priority should be to keep the garment in use for as long as possible before breaking it down into fibre or treating it as waste.Who handles India’s discarded textiles?  India’s textile-recovery system cannot be understood without looking at the workers who already operate within it. Waste pickers, sorters, aggregators and small recycling units play an important role in collecting and recovering materials that formal systems may not reach. Yet much of this work remains invisible in corporate sustainability reporting. That raises an important CSR question: If companies want to build a circular fashion economy, what happens to the workers who are already recovering its materials? A responsible transition should consider fair wages, workplace safety, protective equipment, social-security access and stable incomes. Formalisation should not simply push informal workers out of the value chain. It should improve their working conditions, recognise their contribution and give them a more secure role in the circular economy. Organisations working with waste pickers and vulnerable communities, including Chintan and Goonj, can offer an important perspective on this issue. The worker’s voice matters because circularity cannot be considered fully sustainable if material recovery improves while the conditions of the people doing that work deteriorate.How can companies prove that their circularity claims are real?This is where the evidence test becomes the centre of the story. Saying that a company collected textiles, saved water, used organic cotton or launched a trade-in programme tells us what it did. The more important question is what difference those actions actually made.The more important question is what happened because of that activity.Companies should therefore disclose how much material was collected, how much was actually reused or recycled, what happened to rejected material, how much water was saved against a clear baseline, how much was invested and spent, who benefited and whether the programme continued after the initial funding or pilot period.The reporting boundary should also be clear. A garment collected is not necessarily a garment recycled. A garment recycled is not necessarily a garment returned to an equivalent use. And a sustainability claim is not meaningful unless the company can explain how the claimed benefit was calculated and what happened to the material afterwards. Circular fashion is ultimately not about making better claims about old clothes. It is about building a system in which materials, resources and livelihoods can be tracked from the beginning of the supply chain to what happens after the garment is no longer wanted. THE CIRCULAR FASHION EVIDENCE TEST  ClaimWhat should be proved?“We collected textiles”Total material collected and consumer/beneficiary denominator“We recycled them”Mass balance and material destination“We use recycled fibre”Fibre content and chain-of-custody evidence“We reduced water”Baseline, methodology and actual reduction“We use organic cotton”Certification and sourcing audit trail“We support waste workers”Wages, safety, income and benefit access“We invested in circularity”Budget versus actual expenditure“We reduced our footprint”Absolute and intensity results“Our programme is sustainable”Performance that continues over time This is the difference between a sustainability claim and a sustainability result. A percentage on its own does not tell the full story. Companies should clearly disclose what they measured, where they measured it, the period covered and how the improvement was calculated. A reported 30% reduction may sound significant, but the real questions are: 30% compared with what baseline? Across which facilities? Over what period? Did production increase or decrease? Was the saving measured in absolute terms or per garment? Without this context, sustainability figures can be difficult to verify or compare. Clear reporting boundaries and methodologies are therefore essential to show whether an environmental improvement represents a genuine change in performance. Can India turn textile waste into a resource without leaving its workers behind? India’s policy direction is also moving towards greater textile circularity. The Tex-Eco Initiative, announced in the Union Budget 2026–27, aims to promote globally competitive and environmentally sustainable textile and apparel manufacturing while helping the sector align with international sustainability standards and emerging green markets. Government efforts are also gradually focusing on textile-waste management, recycling technologies and value addition from discarded textiles.This creates an opportunity to move beyond isolated brand-led campaigns and build a wider circular textile system. But recycling cannot carry the entire burden. A genuinely circular apparel model would begin much earlier with durable products designed to last longer, followed by repair, reuse and resale before recycling becomes the final recovery option. That requires action across the entire value chain. Brands need to design garments that are easier to repair and recycle. Retailers need transparent take-back systems. Recyclers need reliable and traceable material flows. Governments need effective standards and enforcement. Consumers need clear information about garment durability, care and disposal. And there is one group that cannot be left out of this transition: the informal workers already collecting, sorting and recovering textile waste. They are not outside the circular economy. In many cases, they are already helping make it work. A truly sustainable textile system must therefore account not only for where the waste goes, but also who handles it, who earns from it and whether those livelihoods become safer and more secure as the system evolves.   THE REAL CIRCULAR-FASHION TESTDESIGN FOR LONGER USE↓REPAIR↓REUSE / RESALE↓COLLECT↓SORT↓RECYCLE↓TRACE THE MATERIAL↓MEASURE THE IMPACT   What should companies actually report?For CSR and corporate sustainability programmes, the most important question is not how many clothes were collected. It is what happened to those clothes afterwards, who handled them, who benefited and what environmental impact was actually avoided. A credible programme should report the total quantity of material collected, where it went and how much genuinely re-entered a productive material or product cycle. It should clearly distinguish between pre-consumer and post-consumer waste, disclose relevant certifications and audit trails, and explain how claims based on those certifications were verified. The people behind the system also need to be visible. When informal workers are involved in collecting, sorting or recycling textiles, companies should report their wages, working conditions, safety measures, access to social protection and how they are being brought into the formal circular economy. Financial reporting should be equally transparent: How much was budgeted? How much was actually spent? How much went towards collection, sorting, recycling, technology, worker protection and infrastructure? The reporting boundary must remain clear throughout. A kilogram collected is not automatically a kilogram recycled.A donated garment is not automatically a garment reused.A certified fibre is not automatically proof that the entire garment has a low environmental footprint.And a percentage reduction means little without a credible baseline and clearly defined methodology. Can fashion become circular without simply moving the waste problem somewhere else? That is the real test of India’s sustainable-fashion transition. India already has a significant textile-recovery ecosystem, with the latest government assessment indicating that more than 70% of textile waste is recovered through different pathways. But recovery alone does not equal circularity. The material still needs to be traced. Workers still need to be protected. Recycling processes still have their own environmental costs. Consumers still need to be encouraged to wear, repair, reuse and resell clothes for longer. And companies still need to demonstrate that their sustainability claims reflect what is actually happening on the ground. This is where the next phase of sustainable fashion will be decided. It will not be defined by how many collection bins a brand installs, how many take-back campaigns it runs or how many recycled garments appear in a catalogue. It will be defined by whether companies can follow a garment from the consumer’s wardrobe to its next useful life - and provide evidence for every major step along the way. Because a fashion system is not circular simply because it collects its waste. It becomes circular when materials stay in productive use, value reaches the people who make the system work, and environmental benefits can be measured and proven. That is the real standard India’s circular-fashion economy now needs to meet. Primary sources:  Ministry of Textiles — Mapping of Textile Waste Value Chain in India (2026)Covers the 70.73 lakh tonnes annual textile-waste estimate, 58% post-consumer / 42% pre-consumer split, recovery pathways, recycling technologies and post-consumer infrastructure gaps.Ministry of Textiles — Mapping of Textile Waste Value Chain in IndiaPress Information Bureau — Ministry of Textiles: Mapping of Textile Waste Value Chain in IndiaOfficial government release covering the report's headline findings, including 70.73 lakh tonnes of annual textile waste and more than 95% recovery of pre-consumer textile waste.PIB — Mapping of Textile Waste Value Chain in IndiaPress Information Bureau — Ministry of Textiles: Textile Recycling and Circular EconomyCovers the government's current textile-recycling and circular-economy initiatives, including the Tex-Eco Initiative.PIB — Textile Recycling and Circular EconomyPress Information Bureau — Ministry of Textiles: Innovative Textile Recycling TechnologiesCovers government support for textile-waste management, recycling, recycled fibres, new materials and value addition from discarded textiles under Tex-Eco.PIB — Innovative Textile Recycling TechnologiesPress Information Bureau — Environmentally Sustainable Production PracticesUseful for the article's cleaner-production, water/energy efficiency, hazardous-chemical reduction, organic textiles, natural dyeing and textile-waste management sections.PIB — Environmentally Sustainable Production PracticesCentral Pollution Control Board — Charter for Water Recycling and Pollution Prevention in Textile IndustriesPrimary regulatory material for the water-consumption, wastewater, chemical use and pollution-prevention angle.CPCB — Charter for Water Recycling and Pollution Prevention in Textile IndustriesPress Information Bureau — Textile Waste Innovation ChallengeDocuments the government's “What Is It Made Of?” Textile Waste Innovation Challenge and its focus on circularity, sustainable production and practical textile-waste solutions.PIB — Textile Waste Innovation ChallengePress Information Bureau — Union Budget 2026–27: Strengthening India's Textile Value ChainUseful for the wider policy context around Tex-Eco, sustainable manufacturing, textile modernisation and circularity.PIB — Union Budget 2026–27: Strengthening India's Textile Value ChainPress Information Bureau — Integrated Programme for the Textile SectorCovers the Budget's broader textile programme, including the Tex-Eco Initiative and sustainable textile manufacturing.PIB — Integrated Programme for the Textile SectorMinistry of Textiles — Textile Recovery Facility, Navi MumbaiParticularly useful for the newer collection, traceability and impact-measurement angle. In August 2026, the Ministry documented a proposed digital circular-textile infrastructure platform for collection, traceability and impact measurement.PIB — Textile Recovery Facility, Navi Mumbai ...Read more

20 Aug 2026

Kolkata | 20 August, 2026  Every day, millions of flowers are offered at India’s temples. Once the prayer is over, however, those flowers become part of a growing waste-management challenge. Across pilgrimage towns, municipalities, temple trusts, women’s self-help groups and private enterprises are trying to give them a second life - as incense, natural colours, compost, flower powder and other products. The bigger opportunity is not simply to prevent flowers from reaching rivers. It is to build a system where ritual waste creates reliable rural livelihoods, supports women and waste workers, and can prove every environmental claim it makes. SummaryTemple flowers can become more than biodegradable waste. They can become products, income and a reason to strengthen local circular economies. But a credible model must answer difficult questions. How much waste was actually collected? Where would it have ended up without the intervention? How much was successfully converted into usable products? Where did the remaining material go? How much did the workers earn? What did the project cost? And, most importantly, can the claimed reduction in river pollution be supported with clear evidence? The future of India’s temple economy may depend less on how many flowers are collected and more on whether the entire chain can be measured and trusted. When Devotion Becomes a Waste-Management ChallengeFor a devotee, flowers are an offering made with faith and devotion. But for temples that receive thousands of visitors every day, those offerings eventually become a large and regular source of organic waste. The problem arises when floral waste is mixed with other garbage or dumped in drains, open spaces and water bodies. Although flowers are biodegradable, that does not make them harmless when large quantities are disposed of, without proper treatment. When floral waste enters water bodies in large amounts, it can increase organic pollution, reduce dissolved oxygen and put additional stress on aquatic ecosystems. The scale of the waste can be significant. At Ujjain’s Mahakaleshwar Temple, which receives an estimated 75,000–100,000 visitors a day, around 5-6 tonnes of floral and other waste are generated daily. A processing plant with a reported capacity of three tonnes per day is part of the temple’s waste-management system, while women’s self-help groups also help turn collected floral waste into useful products. Tirupati offers another example. More than six tonnes of floral waste are reportedly handled every day, with around 150 women from self-help groups involved in recycling the material. These examples highlight an important reality: a major temple is not only a place of worship. It is also a large local ecosystem involving visitors, livelihoods, waste management and the environment. Temple floral-waste scale  Ujjain: 75,000–100,000 visitors/day | 5–6 tonnes floral + other waste/day | 3-tonne/day processing capacityTirupati: 6+ tonnes floral waste/day | 150 women involved in recyclingGulf of Mannar: 849 kg garland waste collected → 155 kg usable flower powder | 60 women involved Can Temple Flowers Become a Source of Livelihood?Floral waste is often discussed as an environmental problem, but it can also become an economic opportunity when it is collected, processed and reused properly. A model in the Gulf of Mannar Biosphere Reserve shows how this can work. Temples were used as collection points, with 15 collection drums installed across five temples, according to UNESCO. Between May and August 2025, around 849 kg of garland waste was collected and processed. After segregation and drying, 155 kg was converted into usable flower powder, while 60 women received training in processing, quality control, packaging, pricing and managing micro-enterprises. The numbers also show why waste processing cannot be measured simply by comparing what is collected with what is sold. 849 kg went into the process, while 155 kg became usable flower powder. That difference is expected. Flowers contain significant moisture, while temple offerings can also contain threads, plastic, synthetic decorations and other unwanted material. Some of the material is removed during sorting, while further losses can occur during drying and processing. Not all collected waste will necessarily be suitable for the final product. This is why credible circular-economy projects need a clear mass balance - tracking how much material enters the system, how much is recovered, how much is converted into products and how much ultimately remains as waste. Collected → segregated → processed → converted into product → sold/used → residual material → final destination. Without that chain, “X tonnes recycled” can hide what happened between collection and the final product.  Who Benefits When Temple Flowers Get a Second Life? The strongest potential of floral-waste circularity may lie in its ability to address waste while creating local livelihoods. Women’s self-help groups can take part in collection, segregation, drying, processing, packaging and sales. This can keep more of the economic value within pilgrimage centres and nearby communities, instead of sending the waste to a distant processing facility.But formalising the waste stream can also affect people who already depend on it for their livelihoods. Before a new floral-waste system is introduced, it is important to ask: Who was collecting, sorting or recovering value from this waste before the project began?Informal waste workers may already be earning an income from these activities. If a formal system replaces their work without including them, it could solve a waste-management problem while creating a new livelihood problem.A responsible circular-economy model should therefore examine whether informal workers are:included in the new system or offered alternative livelihoods;provided formal contracts or predictable payments; given appropriate protective equipment and training;included in decisions that affect their work;given opportunities to participate in higher-value stages of processing and sales; andactually, earning more or receiving a more stable income as a result.The same principle applies to women-led self-help groups. Saying that a project has “created 100 jobs” does not narrate the full story. It is important to know whether these are full-time or occasional jobs, how much workers are paid, who pays them and whether the income will continue after the pilot or CSR funding ends.A circular-economy project should create value not only from discarded flowers, but also for the people whose work keeps that system running.  VALUE-CHAIN FLOW   FLOWER OFFERED → TEMPLE COLLECTION → SEGREGATION → WOMEN/WASTE-WORKER NETWORK → PROCESSING → PRODUCT → MARKET → INCOMEWaste residue → documented destination  Can Temple Trusts Turn Faith-Based Giving into Environmental Action?India’s religious institutions already play a major role in supporting education, healthcare, food distribution, welfare and other community programmes. This gives temple trusts and endowment bodies an opportunity to extend that work into environmental management and circular-economy initiatives.Instead of leaving floral waste entirely to municipal systems, temple administrations could invest in the infrastructure needed to manage it properly, including: separate collection points;storage and transportation systems;processing equipment and facilities;training and protective equipment for workers;support for women-led enterprises;market development for products made from floral waste; andregular monitoring and independent audits. Tirumala Tirupati Devasthanams, for instance, already operates several social-service and charitable programmes through dedicated trusts and institutional structures. This established model of organised giving could be expanded to support environmental stewardship, responsible waste management and sustainable livelihood opportunities for local communities. But funding a circular-economy project is only the beginning. Temple trusts should also be able to demonstrate how that money is being used and what it is achieving. Capital expenditure, operating costs, worker payments, equipment purchases and actual programme spending should be clearly documented. A large budget announcement does not necessarily mean the money has been spent. A large processing facility does not automatically mean the system is functioning. And a finished product on a shelf does not prove that the wider floral-waste stream is being managed responsibly. The real measure of a temple’s circular-economy investment is not how much it announces or builds, but how effectively it turns waste into environmental and social value. Can Private Companies Help Take Temple-Waste Circularity to Scale?Taking temple floral-waste circularity to a larger scale will likely require more than temple trusts and municipal bodies. Private companies can bring the technology, logistics, packaging, market access, training and investment needed to build a more efficient system. Different industries can contribute in different ways. FMCG companies could support product development and distribution, while packaging companies could help create lower-impact packaging for products made from floral waste. Recyclers and producer-responsibility organisations could bring expertise in collection, traceability and material management. Companies in sectors such as automobiles, electronics and batteries could also support floral-waste initiatives through CSR funding, livelihood programmes and wider circular-economy partnerships. Businesses involved in repair and reuse can bring another useful lesson: materials retain greater value when they are kept in productive use instead of being discarded. But corporate participation should not turn floral-waste management into another branding exercise.If a company supports such a project through CSR, there should be clear answers to basic questions: How much money was committed? How much was actually spent? What was built? Who benefited? What results were achieved? And what continued after the funding ended? That transparency is what separates a CSR announcement from a functioning programme that delivers lasting environmental and social impact. Who Is Responsible for Making Temple-Waste Management Work?Temple floral waste does not exist separately from the wider urban waste-management system. In pilgrimage towns, municipal corporations are responsible for local waste collection, sanitation and supporting infrastructure. That makes coordination with temple administrations essential. Running two separate waste systems in the same town can create gaps, duplication and confusion over responsibility. The regulatory framework is equally important. The Central Pollution Control Board (CPCB) and State Pollution Control Boards play a role in pollution monitoring and environmental compliance, while the Ministry of Environment, Forest and Climate Change (MoEFCC) provides the broader policy framework. BIS may be relevant where standards apply to particular products or processes, while the Central Consumer Protection Authority (CCPA) has a role in addressing misleading environmental claims. This becomes especially important as circular-economy projects use environmental benefits as part of their public messaging. India’s 2024 Guidelines for Prevention and Regulation of Greenwashing and Misleading Environmental Claims require environmental claims to be truthful, clear and supported by evidence. Floral-waste projects should meet the same standard. If a project claims to have “saved a river,” the crucial question is whether that claim can be supported by clear, verifiable evidence. Can a Floral-Waste Project Prove Its Environmental Impact?Collecting waste does not automatically tell us how much pollution has been prevented. Suppose a project collects 1,000 kg of flowers. It cannot simply claim that 1,000 kg of waste was diverted from a river. To make that claim, the project needs to establish where that waste would have gone without the intervention. Was it entering a river or other water body? Was it being sent to a landfill? Was it already being composted? Was it being collected separately?The environmental benefit depends on the answer. A credible project should therefore report at least four things: Waste collected: How much floral waste entered the programme?Waste diverted: How much was demonstrably prevented from its documented previous disposal route?Product output: How much was converted into a usable product?Residual waste: Where did the remaining material go? The scale of the project should also be taken into account. Reporting both absolute and intensity-based results can provide a clearer picture.For example: Absolute: 10 tonnes of floral waste diverted in one year. Intensity: 10 kg of floral waste diverted per 10,000 visitors. The second measure can make comparisons between temples of very different sizes more meaningful. Is the Final Product Really the Measure of Circularity?Not necessarily.It is easy to focus on the visible end products - incense sticks, soaps, colours, compost, paper or decorative items made from flowers. But these products represent only one part of the circular-economy process.The system begins with segregation and collection and ends only when the material, money and people involved can be accounted for.That means asking: Material: Where did the collected flowers go?Money: How much was spent and how much revenue was generated?People: Who did the work, who benefited and was anyone’s existing livelihood affected?Environment: What pollution or waste was actually avoided?Market: Were the products actually sold and used, or simply produced?Longevity: Did the model continue after the initial grant, CSR funding or pilot ended?Organisations working on waste management, informal labour and environmental justice - including groups such as Chintan, Toxics Link, Waste Ventures India and Goonj - can bring an important perspective here: a circular system should not only change where waste goes; it should also improve the conditions and opportunities of the people handling it. What Would a Truly Circular Temple-Waste System Look Like?A genuinely circular temple economy would begin before the flower becomes waste.Temples would have dedicated collection systems and ensure that plastic, thread and other contaminants do not enter the floral-waste stream. Municipalities would integrate these systems into local waste-management plans. Temple trusts could support infrastructure, worker training and livelihood development. Women’s self-help groups and existing waste workers could participate across the value chain, rather than being restricted to the lowest-paid collection work. Private companies could contribute technology, logistics, packaging and market access. NGOs and waste-sector organisations could help monitor worker safety, inclusion and environmental outcomes. Regulators could ensure that environmental claims are backed by evidence. The final test is straightforward: Can the project trace the flower from the moment it is offered to its final destination? If it can, that flower becomes more than waste. It can become a product, a source of income, an opportunity for local enterprise and a measurable part of pollution prevention.But if a project cannot show where the waste went, how much became a usable product, how much workers earned, what the system actually cost or how its environmental claims were calculated, then “circularity” risks becoming little more than a label.India does not have to choose between faith and sustainability. It can build systems where faith supports environmental stewardship, environmental action creates local livelihoods and every claimed impact is supported by credible evidence. A flower offered at a shrine should not have to end its journey in a polluted river.But making that journey truly circular requires more than collecting the flowers - it requires tracking their journey and proving what happens to them at every stage.   THE CIRCULARITY TEST” SCORECARD  What a project claimWhat readers should ask“X tonnes recycled”How much was actually collected, processed and converted?“River pollution avoided”Where would the waste have gone without the project?“Women employed”How many women, doing what work, for how much income?“Waste diverted”What was the baseline disposal route?“Circular product”Where did processing residues go?“₹X crore invested”How much was actually spent and on what?“Sustainable”What evidence supports the environmental claim? Before You Call It Circular, Follow the Flower.  “849 KG → 155 KG”Use the Gulf of Mannar case as a simple mass-balance graphic:849 KG GARLAND WASTE↓SEGREGATION + DRYING + PROCESSING↓155 KG USABLE FLOWER POWDER Side panel: 60 women involved15 collection drums5 templesMay - August 2025 “Collected material ≠ final product.”   EDITORIAL EVIDENCE BOX:  For every floral-waste project studied, the reporting checklist should be:  Collection recordsWeighing/mass-balance recordsProcessing capacity vs actual throughputFinal-product quantityResidual-material destinationBaseline disposal routePollution or environmental baselineWorker numbers and actual incomeWorker safety provisionsCSR/temple/municipal budget and actual expenditureSales/market evidenceAudit or certification trailClear reporting boundaryAbsolute and intensity results  Primary sources:  PIB / Ministry of Housing & Urban Affairs — Floral Waste is boosting circularity in economy — Ujjain, Tirupati, temple trusts, SHGs, processing capacity and employment. PIB sourceUNESCO — Advancing Circular Economy and Inclusive Waste Management in the temples of Gulf of Mannar Biosphere Reserve — 5 temples, 15 collection drums, 849 kg collected/processed, 155 kg flower powder, 60 women and processing workflow. UNESCO sourcePIB — Flower Power: India’s Temple Waste Transformation — Ujjain, Siddhivinayak, Phool, HolyWaste and Aaruhi case studies. PIB featureSwachh Bharat Mission Urban — Petals to Profit — official government resource on temple floral-waste recycling and circular-economy models. Swachh Bharat Mission sourceCCPA — Guidelines/Guidance on Prevention and Regulation of Greenwashing, 2024 — substantiation, verifiable evidence and accuracy of environmental claims. CCPA sourceTirumala Tirupati Devasthanams / Andhra Pradesh Endowments material — TTD funds, donations, offerings and permitted social/institutional uses of funds. TTD Endowment Act sourceUNESCO — Phool: A Story of Change — floral waste, river-pollution context, recycling into incense and employment of marginalised women. UNESCO / Phool sourceKolkata Municipal Corporation project — 2026 — temple flowers being collected for incense and herbal aabir, with an initial employment target for 15 women. The available report quotes a senior state municipal-affairs official, so I would treat this as reported municipal information, rather than an independently audited source. Kolkata floral-waste project report ...Read more

19 Aug 2026

Kolkata|19 August, 2026 India’s tourism economy is expanding across its mountains, coasts and biodiversity-rich landscapes, but fragile destinations are reaching the limits of what they can absorb. The next test for responsible tourism is whether growth can protect the ecosystems and communities that make these places worth visiting. SummaryTourism is creating valuable economic opportunities for communities across India’s Himalayan and coastal regions. But the rapid rise in visitors is also putting growing pressure on water, waste management, natural habitats and local infrastructure. A recent carrying-capacity study of Uttarakhand’s Char Dham shows why setting clear limits on tourist numbers is becoming important. At the same time, government policy is gradually promoting carrying-capacity assessments, responsible tourism and community-based models such as homestays. Waste-management partnerships and village-led tourism offer possible alternatives to high-volume tourism, but their success depends on what happens after the initial intervention. For CSR and private tourism investment, the real test is whether ecosystems remain protected, communities retain a meaningful share of the benefits and projects continue to work after the funding cycle ends. How Much Tourism Is Too Much for a Fragile Destination?For popular destinations, more tourists mean more hotels, restaurants, transport services, jobs and income for local communities. But fragile destinations cannot absorb unlimited growth. Mountain region often has limited land, vulnerable water sources, difficult terrain, waste-management challenges and sensitive ecosystems. Coastal areas face their own pressures, including erosion, cyclones, mangroves, wetlands, nesting sites and changing water conditions. The growing pressure is already visible in the Himalayas. A recent study found that visitor numbers to Uttarakhand’s Char Dham reached a record 5 million in 2023.Using geoscientific, biological, socioeconomic and cultural indicators, the study estimated sustainable daily visitor limits of 15,778 for Badrinath, 13,111 for Kedarnath, 8,178 for Gangotri and 6,160 for Yamunotri. These figures are more than tourism statistics. They represent an effort to understand how much pressure a destination can take before tourism begins to damage the natural resources and local communities that support it. The ability to accommodate more visitors is not simply a question of physical space. Water resources, waste systems, forests and local communities may be under significant pressure. Can Tourism Limits Work on the Ground?India is gradually recognising that tourism growth needs to be planned at the destination level, rather than simply focusing on attracting more visitors. The Ministry of Tourism’s National Strategy for Sustainable Tourism calls for better visitor management, physical site planning and greater community participation in tourism decisions. The government is also encouraging states and Union Territories to assess carrying capacity when planning new tourism projects. But the real challenge begins once these assessments are completed. A carrying-capacity report has little value if visitor numbers continue to exceed the limits it identifies. At the same time, restricting tourist numbers is not a simple solution. Fewer visitors may reduce pressure on water, waste systems and fragile habitats, but it can also affect hotels, transport operators, guides, vendors and other local businesses that depend on tourism income. This creates an important policy challenge: how can destinations protect their environment without cutting local communities out of the tourism economy? The answer could lie in better demand management. Timed entry, seasonal visitor limits, promoting less-crowded destinations and strengthening local businesses can help spread tourism more evenly. Instead of concentrating visitors and income in a few high-footfall locations, destinations can create opportunities for more communities to benefit while reducing pressure on fragile hotspots. Absolutely. The ideas are strong, but the language can be made more reader-friendly, smoother and less repetitive, while still keeping the article professional. I’d also simplify the headers so they feel more natural and engaging. Managing Tourism’s Waste, Not Just Measuring ItWaste is often one of the most visible signs of tourism pressure. In mountain regions, poorly managed waste can find its way into water sources, attract animals and affect both wildlife and local residents. In coastal areas, plastic and other waste can pile up along beaches, wetlands and marine ecosystems. This makes waste management an important area for collaboration between travel companies, local authorities and community organisations. But simply collecting waste is not enough. If a tourism company reports collecting hundreds of tonnes of waste, it is important to ask: How much was segregated? How much was recycled or composted? How much ended up in landfills? Who managed the system? And what happened after the CSR funding ended? A more meaningful approach would also measure waste per visitor. This helps destinations understand whether their environmental impact is actually decreasing as tourist numbers increase. The numbers need to be viewed in context. Higher waste collection may simply reflect a rise in tourist arrivals, rather than an improvement in waste management.  Can Communities Lead Tourism?One way to make tourism more inclusive is to spread its economic benefits beyond large hotels and commercial operators. Homestays and community-based tourism allow local households to earn directly from visitors while keeping accommodation smaller and closer to existing communities. Government policy is supporting this model. A 2026 rural-homestay initiative under Swadesh Darshan includes plans for 1,000 homestays in tribal areas, along with financial support for village-level needs, construction and renovation, as well as technical training for homestay owners. Ladakh also launched a Holistic Homestay Support Framework in March 2026, aimed at developing village-led tourism enterprises with a focus on quality, preparedness and sustainability. These efforts point to a broader idea: tourism growth does not always have to depend on large-scale infrastructure. A well-managed homestay can turn an existing household asset into a source of income while giving visitors a more direct experience of local culture. But homestays are not automatically sustainable. A 2026 study of Himalayan homestays in Kalimpong found that their sustainability depends on factors such as infrastructure, accessibility, social conditions and environmental performance. It also highlighted how poorly planned tourism can lead to waste accumulation, environmental damage and greater pressure on local resources. Community-based tourism, too, must operate within the limits of what a destination can sustainably support.   Who Really Benefits When Tourism Grows?For local communities, the real question is not how many tourists a destination attracts, but whether tourism creates stable local incomes without making everyday life more difficult for residents. In Himalayan villages, residents can earn through homestays, guiding, transport and food services. But alongside these economic benefits, communities may also face more waste, greater demands on local water resources and changes to land use.That is why community participation cannot stop at creating jobs. Who owns the land? Who controls tourism development? Who receives and shares the revenue? Who has the authority to decide where infrastructure is built? And do local communities have a meaningful voice when development puts their resources at risk? These questions are particularly relevant in regions where forests, grazing lands and other natural resources are managed through customary systems and community institutions. A stronger community-based tourism model therefore gives residents a meaningful role in decision-making, ownership and sharing of benefits, rather than treating them only as service providers. Recent policy thinking on Himalayan tourism has also emphasised community participation, local workforce development and stronger connections between tourism, conservation and local businesses. What Does Real Community Consent Look Like? Community consent should mean more than simply holding a consultation meeting. When a project affects forests, coastal areas or resources used by local communities, companies should clearly record who was consulted, what concerns were raised and whether those concerns influenced the final plans. For example, if a proposed resort is moved away from a sensitive forest after residents and environmental assessments identify the area as important, that shows avoidance. If local residents receive a share of tourism revenue or own a stake in the business, that is benefit sharing. But if a project moves ahead despite community objections, without showing how environmental and livelihood concerns were addressed, it becomes difficult to call the project genuinely “community-based.” That is why independent community interviews are important. The people living in the destination should be able to speak freely about both the benefits and the costs of tourism, without their responses being shaped by project management.  How Green Is an “Eco-Resort” Really? Certification can help set common standards for sustainable tourism. But having a certificate should not be treated as proof that a project is environmentally responsible. India’s tourism sector is promoting sustainable practices through initiatives such as Travel for LiFE and sustainability criteria for tourism businesses gradually. However, a resort can install solar panels, reduce plastic use and market itself as “eco-friendly” while still consuming large amounts of groundwater, being built on sensitive land or producing more waste than the local system can manage. The real test lies in the evidence. Ask: Was the local ecosystem assessed before construction began? Were sensitive habitats identified and avoided? How much water does the property use per guest? How much waste does it generate per guest? Were local communities meaningfully consulted? How many employees and suppliers are from the local area? And perhaps most importantly: Are these indicators being tracked year after year? A certification may confirm that a resort meets sustainability standards when it is awarded, but long-term environmental performance requires continued monitoring.   What Makes Tourism Regenerative?  THE RESPONSIBLE TOURISM EVIDENCE TEST  Ecological Baseline↓Avoid Sensitive Habitat↓Community Consent & Tenure↓Benefit Sharing↓Waste & Water Performance↓Multi-Year Habitat Monitoring↓Actual CSR Spend & Long-Term Continuity  CSR-funded projects should be judged by more than the numbers announced. Companies should disclose the original budget, actual expenditure and scope of their reporting. If ₹5 crore is announced but only ₹2 crore is spent, the gap deserves explanation. Likewise, a waste-management initiative cannot be considered a lasting success if it works only while CSR funding is available and disappears once the funding ends. For habitat restoration, the number of saplings planted is only a starting point. What matters more is how many survive and continue to grow three or five years later. The same principle applies to community tourism. Counting homestays is useful, but tracking how many remain active, how much income they generate and how much of that income reaches local households gives a far better measure of impact. Can Tourism Grow Without Consuming the Destination Itself? India does not have to choose between tourism and conservation. But it does have to decide what kind of tourism it wants to build and what it is willing to protect along the way. Tourism can create jobs, support local businesses and bring valuable income to communities. But when growth comes without limits, the same industry can put pressure on water resources, waste systems, habitats, infrastructure and the people who call these destinations home. A more responsible approach begins by recognising that growth cannot be measured by visitor numbers alone. It means managing tourist flows, spreading demand beyond overcrowded hotspots, strengthening local businesses, involving communities in decisions and building infrastructure that reflects the ecological limits of each destination. Homestays can help keep tourism income within communities. Waste-management partnerships can reduce the environmental burden of visitors. Carrying-capacity assessments can help establish clear limits. Certification can set standards for more responsible operations. But none of these measures is a guarantee of sustainability on its own. The real test comes years later. Is the destination healthier? Are its natural resources better protected? Are local communities earning more without bearing a greater burden? And are the systems created through tourism still working after the initial funding, publicity or project period has ended? For companies, this means measuring not just what was built, funded or promised, but what continues to deliver results. For communities, it means having a genuine voice in decisions, a meaningful share of the benefits and a say in how their resources are used. For governments, it means turning carrying-capacity assessments into clear and enforceable limits, rather than leaving them as recommendations on paper. A fragile mountain, forest or coastline cannot be treated as an endlessly expandable tourism asset. Its natural resources are not infinite, and neither is its ability to absorb the pressure of visitors. The destination is the asset. And if tourism damages the ecosystem, exhausts the resources and weakens the livelihoods that make a place worth visiting in the first place, the industry is not simply harming the destination - it is undermining its own future. That is why regenerative tourism must ask a different question. Not how many more tourists can this destination accommodate? but: What will still be here, thriving and protected, long after the tourists have gone?   Sources:  Ministry of Tourism, Government of India — National Strategy for Sustainable Tourism (https://tourism.gov.in/index.php/whats-new/national-strategy-sustainable-tourism) (Tourism India)Ministry of Tourism, Government of India — National Strategy and Roadmap for Development of Rural Tourism (https://tourism.gov.in/sites/default/files/2026-02/National%20Strategy%20and%20Roadmap%20for%20Development%20of%20Rural%20Tourism.pdf) (Tourism India)PIB / Ministry of Tourism — Development of 1,000 Tribal Homestays under PM-JUGA (https://www.pib.gov.in/PressReleasePage.aspx?PRID=2212575) (Press Information Bureau)UT Ladakh Administration — Holistic Homestay Support Framework, March 2026 (https://ladakh.gov.in/secretary-tourism-launches-holistic-homestay-support-framework/) (Ladakh Government)Scientific study — Carrying capacity and strategic planning for sustainable tourism practices in the Char Dham, Uttarakhand (https://pmc.ncbi.nlm.nih.gov/articles/PMC12534453/) (PubMed Central (PMC))PubMed — Char Dham carrying-capacity study (https://pubmed.ncbi.nlm.nih.gov/41107367/) (PubMed)Scientific study — Sustainable homestay tourism in the Himalayas: A multicriteria evaluation approach (Kalimpong) (https://www.sciencedirect.com/science/article/abs/pii/S2211464525002568) (ScienceDirect)Ministry of Tourism — Travel for LiFE (https://nidhi.tourism.gov.in/home/page/travel-for-life) (NIDHI) ...Read more

18 Aug 2026

SPECIAL INVESTIGATION  ·  CORPORATE GOVERNANCE & PHILANTHROPY   How India Inc Is Walling Off Its Own Charity — and What It Means for the Grassroots By Professor Ujjwal K. Chowdhury Behind India's ₹40,000-crore CSR economy lies a quiet institutional coup. A tightened Ministry of Corporate Affairs registration regime, a boardroom terrified of personal director liability, and SEBI's data-hungry ESG assurance machinery are together pushing corporate India to build its own foundations — and, in the process, are starving the small, community-rooted non-profits the law was written to reach. SUMMARYSince Form CSR-1 became mandatory on 1 April 2021, and more sharply since the Companies (CSR Policy) Amendment Rules, 2025 came into force on 14 July 2025, the Ministry of Corporate Affairs has converted CSR implementation into a licensed activity. The new web-based, CA/CS/CMA-certified CSR-1 form — demanding 12A/80G proof, NGO Darpan IDs, a three-year track record and digitally signed disclosures — now gates roughly ₹35,000-40,000 crore of annual statutory CSR spend. Boards newly exposed to personal liability for unspent funds under Section 135(5), (6) and (7) are responding by internalising social spending inside wholly owned Section 8 foundations: Tata Steel Foundation, JSW Foundation, Infosys Foundation, Wipro Foundation, SBI Foundation and dozens more. This feature traces the regulatory chain from 2014 to 2026, the cost-benefit and tax arithmetic of building versus outsourcing, hard data on where the money actually lands, and mounting evidence that grassroots NGOs — 84% of India's non-profits, most running on budgets under ₹3 crore — are being pushed out of a philanthropic economy their own advocacy helped build. HASHTAGS: #CSRIndia  #Section8Foundations  #CSR1Registration  #CorporateGovernance  #MCA  #BRSRCore  #GrassrootsNGOs  #CSRCompliance  #IndiaInc  #SocialStockExchange  #NonProfitIndia  #ESGIndia THE BOARDROOM THAT BROKE WITH CIVIL SOCIETY In a wood-panelled boardroom overlooking Mumbai's Bandra-Kurla Complex late last winter, the CSR committee of a top-tier industrial conglomerate faced an existential briefing. For nearly a decade the company had dispersed its mandatory 2% statutory spend — roughly ₹140 crore a year — across a decentralised constellation of 45 grassroots NGOs working the rural hinterlands from Kalahandi to Bastar. Then came the regulatory audit. A routine notice from the Registrar of Companies, coupled with statutory-auditor queries over third-party utilisation certificates, Form CSR-1 validations and unspent-escrow allocations under Section 135(6), pushed boardroom anxiety to a fever pitch. By the time legal counsel finished briefing directors on personal liability under the amended penalty provisions, the decision was unanimous: terminate 38 external partner contracts and incorporate a wholly owned, captive Section 8 not-for-profit. “Within eighteen months, our entire social budget was internalised. It wasn't philanthropic philosophy — it was regulatory survival.” — Chief Sustainability Officer, industrial conglomerate This boardroom pivot is neither isolated nor accidental. Across corporate India a seismic restructuring of statutory philanthropy is under way. What began in 2014 as a broad legislative mandate under Section 135 of the Companies Act has hardened into a tightly policed, data-audited compliance machinery — and in its place has arisen a sprawling new institutional class: the captive corporate foundation. FROM ‘COMPLY OR EXPLAIN’ TO A COMPLIANCE MACHINE Section 135 was notified in 2014 as a soft ‘comply or explain’ regime — a company could simply justify a shortfall in its board report. That leniency did not survive long. A High-Level Committee on CSR (2019-20) recommended tightening; the escrow mechanisms of Section 135(5) and (6) followed; then, in 2021, came Form CSR-1 and the decriminalisation-cum-mandatory-impact-assessment amendments. By 2023-26, SEBI's BRSR Core reasonable-assurance regime and the Social Stock Exchange had pulled CSR into the wider architecture of ESG disclosure. 20142019‑2020212023‑26Section 135 notified — the ‘comply or explain’ era begins.High-Level Committee on CSR; Section 135(5)/(6) escrow mechanisms introduced.MCA Form CSR-1 mandatory; decriminalisation amendments; mandatory third-party impact assessments.SEBI BRSR Core reasonable assurance rolls out; Social Stock Exchange goes live; CSR-1 re-engineered (July 2025). FORM CSR-1: THE FORM THAT REWROTE THE RULES The decisive shift began on 1 April 2021, when it became illegal for any company to route CSR capital to an implementing agency lacking an MCA-issued, eleven-digit unique CSR Registration Number. To secure that number, a Section 8 company, registered public trust or registered society had to demonstrate valid Section 12A/12AB and 80G registrations, a verified three-year operational track record in comparable development work (waived only for Section 8 entities established by the funding company itself), and Digital Signature Certificate verification certified by a practising Chartered Accountant, Company Secretary or Cost and Management Accountant. The ground shifted again on 14 July 2025, when the Companies (CSR Policy) Amendment Rules, 2025 replaced the old PDF-based process with a fully web-based e-form on the MCA21 V3 portal — now demanding an NGO Darpan ID as a compulsory field, governing-body member details with DIN/PAN, audited financials, and OTP-verified, digitally signed submission. MCA subsequently clarified that entities already holding valid CSR registration numbers need not register afresh merely because the form changed. Running in parallel, the Ministry of Home Affairs tightened the Foreign Contribution (Regulation) Act, cancelling the licences of over 6,000 civil society organisations and banning sub-granting between NGOs. CSR funds are technically domestic capital, but the institutional fallout — lost accounting staff, deep regulatory scrutiny, sudden instability — hit thousands of multi-funded grassroots entities regardless. THE ESCROW TRAP: WHEN NON-COMPLIANCE BECOMES PERSONAL For corporate legal teams, the cost of an implementing partner's compliance lapse has become intolerable. Under Section 135(5) and (6), unspent capital tied to an ‘ongoing project’ must move within 30 days of fiscal close into a designated Unspent CSR Account at a scheduled bank, to be utilised within three fiscal years — or, for one-off projects, surrendered within six months to a Schedule VII fund such as PM CARES or Clean Ganga. Section 135(7) penalises failure with fines running up to twice the unspent amount for the company, plus personal financial liability for every defaulting officer. Recent RoC adjudication orders — some now under appeal — show that enforcement is real, not theoretical. A further procedural tightening in 2025 requires companies to file Form AOC-4 (audited financial statements) before filing Form CSR-2, the annual CSR report; the CSR-2 web form must now carry the AOC-4 Service Request Number to link it algorithmically to audited accounts. Regulators can now cross-reference CSR spend against financials in real time, closing off the discretion companies once used to smooth over reporting gaps. THE GREAT SPIN-OFF: MAPPING INDIA INC’S CAPTIVE FOUNDATIONS The stampede toward captive vehicles has reshaped the institutional map of Indian philanthropy. Data compiled from the MCA portal, the Registrar of Companies and analytics platform CSRBOX show that over 65% of the NIFTY 100 now execute the majority of their social spend through promoter-backed Section 8 companies, captive trusts or dedicated operating foundations — and, since the 2025 CSR-1 overhaul, more than 60% of large corporate CSR budgets are routed through company-owned implementation arms. Yet corporate India is not converging on one model. In heavy industry, Tata Steel Foundation — a Section 8 company and wholly owned subsidiary of Tata Steel — has saturated 81 blocks and 4,500 villages across Jharkhand and Odisha, spending roughly ₹473 crore in FY2024-25, reaching between 5.77 million and 6.9 million lives across different reporting cycles and unlocking over ₹5,300 crore of public entitlements through grassroots mobilisers. Under its MANSI maternal-health programme, 93% of high-risk pregnancies now culminate in institutional deliveries; through Masti Ki Pathshala, 73% of 5,406 highly vulnerable children in Jamshedpur's urban slums have entered mainstream schooling. JSW Foundation scaled from ₹63 crore in FY2018-19 to ₹235 crore in FY2023-24 and ₹363 crore in FY2024-25, touching 30 lakh lives across Maharashtra, Karnataka and Odisha. In technology, Infosys Foundation — three decades old in FY2026 — has deployed cumulative spending above ₹4,800 crore, with FY2024-25 alone seeing ₹545 crore across healthcare, education and environment, and FY2025-26 global CSR of about ₹666 crore reaching more than seven million people across 200-plus projects; its annual report won a Gold Stevie in 2025, even as a 2026 fraud case — a former contractor who posed as a regional head to defraud the foundation of ₹6 crore — exposed governance vulnerabilities that scale alone cannot fix. TCS reported FY2024-25 CSR of ₹960 crore, rising to a global figure of about ₹1,153 crore in FY2025-26 with more than 18 million beneficiaries and over nine million volunteering hours, through flagship programmes such as goIT, Ignite My Future and BridgeIT reaching 7.1 million people worldwide. Wipro runs a deliberate dual-engine architecture: the endowment-backed Azim Premji Foundation, which holds an economic interest in Wipro and preserves pure civil-society funding, alongside Wipro Foundation and Wipro Cares, which executed statutory CSR of ₹259.4 crore in FY2024-25 and ₹227.4 crore in FY2025-26 against an adjusted obligation of ₹130.4 crore — a zero-shortfall result. Among banks, HDFC Bank's Parivartan posted a record ₹1,068 crore in FY2024-25 across seven focus areas — including a newly added natural-resource-management vertical — reaching over 100 million beneficiaries through 214 implementation partners. SBI institutionalised its CSR inside SBI Foundation, a Section 8 company, spending ₹610.77 crore. ICICI Bank earmarked ₹801 crore but spent only ₹527 crore, citing delays in statutory approvals — a reminder that even large, well-resourced banks face implementation lag. Axis Bank Foundation, notably, is a registered trust rather than a Section 8 company and openly runs a partnership model with multiple development-sector organisations, showing that the captive-foundation trend is not universal even among peer institutions. In agribusiness, ITC's Mission Sunehra Kal spent ₹325 crore in FY2023-24, embedding climate-smart agriculture and e-Choupal watershed development directly into its sourcing catchments, creating a circular loop in which agroforestry CSR supplies pulpwood for its paperboard business. Reliance Industries, largely through Reliance Foundation, led all spenders at ₹2,156 crore in FY2024-25. THE HIDDEN P&L: WHY BUILD BEATS BUY Running an in-house foundation is not cheap. Registering a Section 8 company — the preferred structure — costs roughly ₹18,000-35,000 in government and professional fees, with annual compliance of ₹15,000-40,000 covering statutory audits, RoC filings (MGT-7, AOC-4), income-tax returns and 12A/80G maintenance. That is markedly steeper than a trust (₹500-3,000 to register; ₹5,000-15,000 a year) — yet for companies with large, recurring CSR budgets the arithmetic still tilts toward internalisation. The decisive lever is Rule 7(1) of the CSR Rules, which caps administrative overheads at 5% of total CSR spend for the company itself — but explicitly excludes the administrative expenses of implementing agencies, including a company's own Section 8 foundation, from that cap. Grassroots NGOs typically need 15-20% institutional overhead to cover compliance, monitoring, senior management and rent; bound by the 5% ceiling, corporates routinely disallow these core costs when funding external partners, forcing NGOs into project-restricted budgets that erode their long-term health. A captive foundation, by contrast, allows structural reclassification: salaries of social workers, agronomists, project directors and field-monitoring teams are booked not as ‘administrative overhead’ but as direct programmatic implementation expense — full operational capacity, while the general-administration line on paper stays comfortably under 5%.  Outsourced NGO Model (₹100 Cr Spend)Captive Section 8 Model (₹100 Cr Spend)External grant / direct programme₹95 Cr grant, capped at 5% overhead (Rule 7(1))₹96 Cr — field salaries booked as direct delivery cost, not overheadOverhead / admin₹5 Cr — partner NGO's core costs largely disallowed₹4 Cr head-office admin, technically within the 5% capNet effectOperational friction for the NGO partnerFull in-house operational capacity retained inside the group Tax structuring compounds the advantage. A Section 8 foundation without 12A registration is taxed at the ordinary corporate rate — an effective 29-33% including surcharge and cess — which is why 12A is treated as non-negotiable; newly registered entities get a provisional 12A (Form 10A, valid three years) before moving to regular 12AB (Form 10AB, valid five years, extendable to ten years for foundations with annual income under ₹5 crore). Once secured, foundation income is 100% tax-exempt if applied to charitable objects. Section 80G then lets the donor — typically the parent company — claim a deduction of 50% on the donated sum, subject to a ceiling of 10% of Adjusted Gross Total Income (cash donations above ₹2,000 do not qualify; the foundation must file Form 10BD and issue Form 10BE to preserve the donor's claim). On a ₹10 crore contribution, that works out to a ₹5 crore deduction and, at a 30% marginal rate, roughly ₹1.5 crore of tax saved by the parent — while the foundation itself receives the full ₹10 crore tax-free. There is a catch worth flagging for the balance sheet: when a 12A-registered foundation passes money onward to other NGOs, 15% of that onward transfer is disallowed from tax exemption, creating an effective 30% tax cost on unstructured pass-through grants — one more reason captive foundations prefer to spend directly rather than sub-grant. And Mumbai ITAT rulings through 2025-26 have clarified that CSR donations to 80G-approved entities can claim the 80G deduction even though CSR itself is disallowed as business expenditure under Section 37(1) — clearly so for voluntary spending above the mandatory 2%, more contestably so for the mandatory 2% itself. FOLLOW THE ₹40,000 CRORE: WHERE THE MONEY ACTUALLY GOES Reported national CSR expenditure rose from ₹24,965.82 crore in FY2019-20 to ₹34,908.75 crore in FY2023-24 — more than ₹1.44 lakh crore across those five years, and over ₹2.17 lakh crore cumulatively since 2014. A July 2026 private analysis by Fulcrum, based on corporate filings, estimates FY2024-25 spending at about ₹40,794 crore across 29,546 companies and 72,233 projects — a research estimate, not yet the government's own consolidated figure, but directionally consistent with NSE data showing listed companies alone spent ₹22,212 crore in FY2025, up 23% year-on-year, with the top 10 companies contributing 34% of that total. Thematically, the captive model has produced herd behaviour. According to CSRBOX analytics, Education and Skill Development absorbs roughly 38% of national CSR capital and Healthcare and Sanitation another 27% — together nearly two-thirds of all corporate spending — while Rural Infrastructure takes 12%, Environmental Sustainability just 6%, and Gender and Vulnerable Groups only 4%.   ThemeShare of National CSR SpendEducation & Skill Development38%Healthcare & Sanitation27%Rural Infrastructure12%Other Schedule VII heads13%Environmental Sustainability6%Gender & Vulnerable Groups4% Environmental CSR, while the fastest-growing category — up 54% year-on-year in FY2023-24 to roughly ₹3,500 crore, per CEEW — remains a rounding error against India's climate-finance need: the Climate Policy Initiative India estimates ₹162.5 trillion (about $2.5 trillion) is required by 2030 to meet the country's Nationally Determined Contributions, of which current tracked green finance for mitigation covers only about 30%. CEEW argues CSR could become a major financing source for clean air — clean mobility, waste management, crop-residue solutions, construction-dust reduction — but notes that such programmes cluster around existing corporate locations and frequently lack measurable outcomes. WRI India separately flags biodiversity's marginal CSR share. Geography compounds the theme problem. Despite statutory language urging companies to prioritise their local operating areas, Maharashtra, Gujarat, Karnataka, Tamil Nadu and Andhra Pradesh — the states with the highest concentration of corporate headquarters — together absorb over 45% of all national CSR outlays. NITI Aayog's 112 Aspirational Districts and 500 Aspirational Blocks, precisely the geographies where marginal investment could generate the most disproportionate impact, receive only 2-4.5% of total CSR funds between them. And headline compliance conceals an implementation gap: NIFTY 500 annual reports show that even as reported compliance sits above 95%, 8-12% of committed capital is parked in Unspent CSR Accounts under Section 135(6); over ₹1,000 crore went unspent in FY2021-22 alone and had to be transferred to government Schedule VII funds. THE GRASSROOTS SQUEEZE The most consequential casualty of this restructuring is India's smallest, most rooted non-profits. Roughly 84% of Indian NGOs run on annual budgets under ₹3 crore — yet only 71% of CSR-1-registered NGOs actually accessed corporate funding in FY2023-24, leaving nearly three in ten locked out despite having cleared the registration bar. A 2025 Fulcrum survey of 325 NGOs across more than 20 states found that 89% held valid CSR-1 registration, but only 71% received any CSR money; about 80% reported inadequate opportunities to network with corporates; nearly half faced project-documentation difficulties; 40% experienced delayed fund disbursement; and 61% lacked the technical MIS expertise corporate due-diligence teams now expect. Small NGOs saw proposal-acceptance rates of roughly 50%, against about 73% for larger organisations. “A small organisation working on forest rights in Bastar cannot afford the compliance overhead that a corporate foundation's legal department takes for granted.” — Senior researcher, Centre for Science and Environment The barriers compound. Hiring a CA, CS or CMA solely to certify a CSR-1 filing adds ₹15,000-25,000 in professional fees — a material sum against a ₹20-30 lakh annual budget. The three-year track-record rule excludes newer or informally structured community organisations by design. The ban on sub-granting has eliminated the traditional intermediary model, through which large aggregator grantmakers once dispersed micro-grants to unheralded community groups; capital must now flow directly from company or foundation to final implementer, cutting hyper-local groups out of the pipeline entirely. Surviving small NGOs are increasingly demoted from co-equal strategic partners to third-tier field contractors — conducting surveys or distributing materials on razor-thin management fees, without budget for staff healthcare or institutional capacity-building. An ₹800 crore CSR-diversion racket uncovered across six states in 2025-26 has only sharpened corporate caution, disproportionately penalising honest but less-polished grassroots groups. And a May 2026 MCA notification recognising Zero Coupon Zero Principal (ZCZP) instruments on the Social Stock Exchange as a valid CSR channel — while officially framed as widening CSR's ambit — has been described by critics as tilting the playing field further toward large, listing-ready organisations, at the expense of community-based groups too small to meet SSE disclosure norms. THE GOVERNANCE MIRAGE: IS BIGGER ACTUALLY BETTER? Is the captive corporate foundation a genuinely superior vehicle for social transformation, or a tax-exempt marketing division wearing a Section 8 registration? Proxy-advisory and governance researchers urge scrutiny of the premise itself. “When a company routes its entire CSR allocation through an in-house Section 8 entity, board oversight must be twice as vigilant. Is the foundation's board genuinely independent? Are procurement contracts subject to arm's-length competitive bidding — or is the foundation a soft-money vehicle for the parent's brand and executive pet projects?” — Amit Tandon, Institutional Investor Advisory Services (IiAS) IiAS's 2024 Corporate Governance Scorecard found that 94 of the BSE 100 now meet the 2% spend threshold, up from 74 the previous year — but only 54 of the BSE 100 conducted impact assessments in FY2024, unchanged from FY2023, suggesting that measurement remains driven by legal mandate rather than mission. InGovern's Shriram Subramanian points to the underlying logic: once personal penalties for board directors and statutory escrow timelines entered the picture, boards concluded that reliance on third-party non-profits carried unacceptable legal risk, and that a captive vehicle offered what no external NGO could guarantee — absolute operational line-of-sight, brand control and an unassailable audit trail. The pros are real: continuity across CSR-head turnover, comparable multi-year data, the ability to hire genuine sector specialists, replicable multi-state programme design, and clearer board-level accountability than a scattershot grants portfolio ever offered. The cons are equally real: concentration risk, potential self-dealing between parent and foundation, thematic herd behaviour toward ‘safe’ brand-accretive causes, and — as Infosys Foundation's own 2026 fraud episode showed, in which a former contractor posed as a regional head to defraud the foundation of ₹6 crore — the loss of the deep, hyperlocal community trust that independent NGOs spend decades building and that no ERP dashboard can substitute for. SEBI, BRSR CORE AND THE SOCIAL STOCK EXCHANGE The foundation boom is accelerating under market-driven sustainability regulation running in parallel to CSR law. SEBI's BRSR Core framework requires the top 1,000 listed companies to disclose roughly 30 designated environmental and social KPIs, with independent reasonable assurance phased in from the top 150 companies to all top 1,000 by FY2026-27; non-compliance can draw penalties of ₹2,000 a day under the LODR framework, with SEBI enforcement penalties running up to ₹1 crore. The Reserve Bank of India has entered from the banking side, through its 2023 Green Deposits Framework and a 2024 draft climate-risk disclosure framework aligned with TCFD standards — pulling bank CSR into climate-risk management rather than treating it as siloed philanthropy. “If ESG data comes from dozens of dispersed, un-audited NGOs, the assurance provider will qualify their opinion. If it flows from a captive Section 8 company with ERP tracking, the process is smooth. Corporates are building foundations because foundations are data pipelines.” — ESG Director, Big Four audit firm The Social Stock Exchange, launched by SEBI with the BSE and NSE, was designed to let non-profits raise capital through Zero Coupon Zero Principal instruments and democratise social finance; companies can now allocate up to 10% of CSR expenditure this way. In practice, the SSE demands the same sophisticated disclosure norms and social-audit verification that have already strained grassroots non-profits — so early issuances have been dominated by well-funded, professionally managed and corporate-backed entities, reproducing at market scale the same exclusion visible in CSR-1 registration. THE SEVEN-QUESTION EVIDENCE TEST Every large CSR claim — corporate or foundation-issued — should now survive seven tests before it is taken at face value: Methodology: was there an explicit theory of change and an independent evaluator, or simply a beneficiary head-count?Baseline: what were incomes, water use, school enrolment or health indicators before the intervention began?Comparison group: measured against the previous year, a non-programme geography, industry peers, or a genuine control group?Implementation gap: did a board-approved allocation actually become a signed contract, deployed capital and completed field expenditure — or only the first of those?Reporting boundary: when a foundation funds three NGOs, who counts the beneficiaries, and are repeat beneficiaries double-counted?Absolute versus intensity: does ‘one billion litres conserved’ also tell us conservation per hectare, per beneficiary, or against baseline?Money trail: what is the gap between the statutory 2% obligation, the approved programme budget, cash actually spent, unspent balances, and asset ownership? Platforms such as India CSR and CSRBOX track corporate foundations and spending at scale, and MCA's own CSR-2 annual filing offers a layer of transparency — but without mandatory third-party impact audits, the quality of self-reported outcomes still varies enormously across the ecosystem. THE POLICY CROSSROADS: FIVE PILLARS FOR REFORM India's CSR experiment has already answered its first-generation question — social spending can be mandated at national scale. The harder, second-generation question is whether ₹35,000-40,000 crore of annual corporate capital can be made more accountable without becoming more distant from the people it is meant to serve. Policy thinkers converge on five interventions: MCA reform: carve out a mandatory 20-25% grassroots allocation quota, directed to independent, community-rooted non-profits operating in NITI Aayog's Aspirational Districts and Blocks.SEBI mandate: incentivise listed companies on the Social Stock Exchange to back independent, non-captive NPOs rather than only large, listing-ready organisations.RBI incentives: link Priority Sector Lending benefits to demonstrated corporate backing of rural micro-NGOs.Overhead relief: modernise the Rule 7(1) admin cap into a tiered structure — 5% for captive foundations, but 12-15% for grants to independent grassroots partners, so they can invest in compliance, technology and fair staff wages.Regional equalisation: create a pooled national fund, or tax and ESG credits, to channel CSR capital toward historically underfunded regions, alongside a single-window CSR-1/12AB/80G/Darpan compliance pathway for NGOs with budgets under ₹1 crore.   CONCLUSION: CONTROL VERSUS COMMUNITY The corporatisation of CSR has professionalised social spending: it has curtailed fraudulent balance sheets, built modern community infrastructure, brought enterprise-grade technology to the development sector, and mobilised tens of thousands of crores with genuine audit precision. Section 8 foundations bring governance discipline, institutional continuity and scale that the early, freewheeling years of mandatory CSR often lacked. But that efficiency has arrived alongside a quieter cost — the marginalisation of a pluralistic, independent civil society. Section 135 was conceived as a bridge between corporate success and societal well-being. If that bridge hardens into a closed loop of captive corporate vehicles feeding data pipelines rather than communities, the letter of the law will have triumphed over its spirit. The evidence test remains open: until independent, standardised impact assessments compare foundation-led projects with NGO-implemented ones on the same terms, the true cost — and the true benefit — of India's captive-foundation era will stay only partially visible. What is no longer in doubt is that India's CSR story has stopped being a story about compliance. It is now a story about power, control, and who gets to decide what ‘impact’ means for the country's poorest and most remote communities. SOURCES: The writer compiled this feature from Ministry of Corporate Affairs and Registrar of Companies filings, SEBI and RBI circulars, corporate annual reports and BRSR disclosures, the MCA CSR-1/CSR-2 portals, CSRBOX and India CSR analytics, Fulcrum's 2025 NGO survey, and assessments by IiAS, InGovern, CSE, WRI India and Climate Policy Initiative India. ...Read more

13 Aug 2026

Summary: Crippled with financial stagnation and vagaries of monsoonal rainfall, Indian farmers are always on the subdued part of the see-saw ride. Enhancing this burden, here comes the most controversial pact of this year – the India-US Agricultural deal. Opening up like a free market to the corporate giants, this deal is sure to feed the corporate sharks let alone the hapless farmers of India. Exemption of import duties shall open the floodgates of American crops and food items flocking the Indian market, forcing the teeming millions to spend a lumsome on the imported items while the production at home is sure to lose it’s share in the market. Disastrous to the common people of India, this deal has opened many questions which are yet to be answered. by Dr. Kanailal Das Farmers have small landholdings, so the mechanisation in agricultural sector is not a dominant feature. Moreover Indian agriculture is largely determined by the rainfall pattern of monsoon. As arrival, duration and departure of monsoon winds is uncertain, the production of crops is also uncertain, production varies from year to year. During weak or delayed monsoon production of crops is hampered. Indian agriculture is also highly labour intensive. Large share of the population is engaged in agricultural activities. Low productivity is also another major feature of Indian Agricultural System. Crop yields are lower than in many developed countries because of small farms,limited scope of irrigation and traditional farming practices . But the agriculture has the central role in Indian economy. Large numbers of population select their livelihood from agriculture. Indian agriculture produces essential food grains, vegetables, fruits, pulses and dairy products for India's large population. Many industries depend on agriculture produce. Agriculture supplies raw materials for jute and cotton textile industries. Sugar industry and food processing industries largely depend on the raw materials like sugarcane, fruits and food crops etc. Photo: Glimpse of agriculture in India (photo by author) The income of farmers is mostly uncertain and meagre. Crop prices fluctuate sharply, while the cost of seeds, fertilisers, diesel, pesticides and labour costs are increasing rapidly. Farmers with small and fragmented landholdings cannot use modern technology hence the production cost remain high, production remains low and the market prices are ever fluctuating. Droughts, floods, irregular rainfall and the seasonal and spatial variation of rainfall affect the production and the farmers get into trouble every now and then. 6th February 2026 saw the official announcement of India - US trade agreement by US president Donald Trump. The United States of America and India agreed on a framework under which India would reduce or eliminate tariffs on selected agricultural products, while the US would reduce its reciprocal tariff on Indian goods to 18%. The major features as stated are , 1. The Government of India will completely eliminate or significantly reduce import duties on all US industrial goods. 2. American food grains and agricultural products will be completely waived or drastically reduced in Indian markets . The major products include animal feed, sorghum, almonds, fruits, soybean and soybean oil, various types of pulses, dairy products, eggs and poultry meat. 3. India agrees to purchase increasingly more industrial goods in future, amounting to 45 to 50 lakh crore rupees over the next 5 years  4.  The US Government had imposed a 25% tariff on Indian goods exported to US markets. This amount of tariff will now be reduced to 18%. A 25% tariff had also been imposed on India as a penalty for importing oil from Russia ( effective from August 2025). Now it has been proposed to lift the tariff on the condition that India will no longer import oil from Russia and India will import oil from USA and Venezuela. American farmers comprise only 2% of the total population of the country and they get huge amount of subsidy, where as in India nearly 68% of the total population are engaged in agriculture with the traditional methods on the small and fragmented landholdings unsuitable for mechanised and commercial production . In India 84% of the landholdings are unprofitable . US agriculture is highly mechanised and modern in nature . The farmers are rich with large landholdings. The agriculture of America is highly commercial in nature . So Indian farmers are facing great problems as the farmers are not getting remunerative price for their crops . The price of fertilizer, seeds, pesticides and the cost of irrigation is rising heavily in India. So there is massive gap between income and expenditure in India . Under these circumstances Indian will definitely be in disaster after the India US trade deal . The import duty shield in India has long been a practice in the field of agriculture to protect the farmer's interest in international competition. Previously, this import duty averaged around 150%, after 1990,with the introduction of new economic and industrial policies it gradually dropped to 37%. And now import duties on US agricultural products will be eliminated. As a result, Indiast poor farmers will be thrown right in front of American rich farmers . Some examples can be provided , 1.  At present an import duty of 55% to 81% is to be paid to import foreign dairy products in india. After the agreement , American dairy products will enter without any import duty and it will destroy the country's dairy industry. 2. Until now the import duty on soybean was 55%, with the removal of the import duty nearly 5 crore farmers of India will be affected. 3. In India almost 4 crore farmers are engaged in poultry sector . Apart from chicken farmers produce 14,200 eggs annually. If the import duty on poultry sector is eliminated American cheap poultry products will capture the Indian market and this sector will be ruined. 4. According to the agreement US apples will enter the Indian markets without any import duty. At present apples from Britain are coming to the markets of India on the basis of an agreement signed few months ago . As a result already the apple farmers of Kashmir and Himachal Pradesh are facing problem. Again American apples, grapes, banana, orange will flood the Indian markets creating crisis . Huge production of fruits of India may be decomposed . 5. Cotton is the most important commercial fiber crops of India. India earns huge amount of revenue from cotton and cotton textile goods. According to the agreement if Bangladesh import cotton from America, the industrial finished products , the textile goods can be sold in American markets without any duty. Till date a major portion of cotton is exported to Bangladesh . After the agreement India will lose the cotton market in Bangladesh. Bangladesh will not import cotton from India and Indian farmers engaged in cotton cultivation will face great loss . 6. Disaster will also strike pulse production. Around 3 crore of farmers are engaged in the production of pulses . There is currently an import duty of around 30% on pulse imports . Once that is lifted the importers will bring pulses from America . Domestic pulse production will face devastating picture . Now the question is important , who will buy and bring the massive volume of US agricultural goods. Definitely giant import export agricultural business corporates will do this . Mainly Adani Group will play vital role in this sector . They will buy US agricultural products without import duty and sell in the markets by higher prices .. They will get huge amount of profit. But the producers of India , the Indian farmers will be in great dangers . They will not be able to lead an uneven fight with the corporates like Adani Groups. And what about Ambani? The India-us Trade agreement is highly profitable for Reliance Industries Limited. The recent agreement signed by the Reliance Industries with America involving a capital expenditure of 27 lakh crore rupees to set up a massive oil refinery in Texas will be immensely aided by the agreement. But what is the future of the common people? What is the future of the farmers and workers of the country? The farmers of India are protesting now against the agreement. The lowering of import tariffs of US products will flood the domestic markets with cheaper, heavily subsidized American agricultural products. Farmers groups under alliances like the Desh Bachao Morcha launched nationwide demonstration including a major Kishan Mahapanchayat in Delhi citing direct threats to their livelihoods . Indian Agricultural Policies  Bonfire for Corporate Companies Pyre for Peasants .AIKKMS Publication. Kheye pore banchar golpo , Moitrish Ghatak, Anandabazar Patrika , 22/4/2026 Biswajit Dhar , India -US Trade agreement,13/2/2026.   ABOUT AUTHOR   Dr Kanailal Das Masters in Geography from University of Calcutta, former senior research fellow, CSIR, PhD on Vulnerability of Gosaba, Basanti, Sundarban from Vidyasagar University. He has participated in many national and international seminars and has papers and book chapters to his credit.  ...Read more

13 Aug 2026

Sustainability is not only about saving the planet; it is also about changing the way we create, consume and live. Art and design can help us imagine a world where beauty and responsibility go hand in hand.    By Ankan Bandyopadhyay   At one point in human history, artists mainly created paintings around religion, mythology and stories of the divine. Art gradually changed as society changed. The Renaissance brought a greater interest in the individual and the human experience. Later, artists began to question traditional ideas about what art could be and where it could exist. This eventually led to movements such as Land Art, where nature itself became the subject, material and sometimes even the space of the artwork.    This relationship between art and nature has continued to evolve. Today, sustainability has become an important subject not only in art but also in design, architecture, fashion and everyday life.    Artists, writers, poets and designers are increasingly using their work to make people aware of environmental problems. Art has the power to make people stop, look and think. A painting about a polluted river may communicate something that a page full of statistics cannot. A sculpture made from discarded plastic can make us realise how much waste we produce every day.    This is where art and sustainability meet.   What does sustainability really mean?  In simple words, sustainability means using what we have responsibly so that future generations can also use it.    It does not mean that we have to stop making things or stop enjoying beautiful objects. It means we need to think about how things are made, what they are made from, how long they will last and what happens to them after we stop using them.    Take a simple example: a plastic bottle may be used for a few minutes, but the material can remain in the environment for hundreds of years. If millions of people use and throw away such products every day, the problem becomes enormous.    This is why sustainability has to become part of the way we think about design.   Design begins with a material  A designer makes choices every day. What material should be used? How much of it is required? Can it be repaired? Can it be reused? What happens when the product is no longer useful?    For example, many companies are replacing unnecessary plastic packaging with paper, cardboard or cloth. A cloth bag can be used repeatedly instead of receiving a new plastic bag every time we go shopping.    Even advertising materials can be reconsidered. Posters and hoardings often use materials that are difficult to reuse or recycle. Could some of these be made from cloth or other reusable materials? Such changes may seem small, but when adopted on a large scale, they can make a significant difference.    Businesses have an important role to play here. Sustainability cannot be the responsibility of individuals alone. Manufacturers, brands, designers and policymakers must also take responsibility for the materials they introduce into society.    What happens to our waste?  Look around us.    Garbage is often found along roadsides. Plastic bottles and wrappers collect in drains. Plastic waste enters rivers and eventually reaches the sea. Animals can mistake plastic for food or become trapped in it. What looks like a small piece of waste to one person can become part of a much larger environmental problem.    We often think of waste as something that disappears once it leaves our hands. But it does not disappear. It simply goes somewhere else.    This is why our everyday habits matter.   The practice of automatically giving a plastic bag with every purchase needs to change. We can carry reusable bags instead. We can use refillable bottles instead of buying disposable ones. We can repair things instead of immediately replacing them.    Even something as simple as having properly maintained waste bins at important public places can encourage better waste disposal. But infrastructure alone is not enough. People also need to be aware of why responsible waste disposal matters.    Sustainability begins with both systems and behaviour.    Can art change the way we think? Artists have a unique role in this conversation.    An artist does not always have to create a work that directly says, "Save the environment." Sometimes the material itself can communicate the message.    Imagine a large sculpture made entirely from discarded plastic bottles. The viewer does not need a long explanation to understand that the amount of plastic waste around us has become enormous.    This idea of transforming discarded objects into art is not new. Assemblage, for example, brings together everyday or discarded objects to create an artwork. Pablo Picasso's Bull's Head is a famous example. Picasso created the work by combining a bicycle seat and handlebars to suggest the head and horns of a bull. The work demonstrates how an ordinary object can be given a completely different meaning through creative thinking.    Artists such as Louise Nevelson also became known for constructing large sculptural compositions from found wooden objects. Her work shows how discarded or ordinary materials can be reorganised into something visually powerful.    The important lesson is that an object does not necessarily become useless simply because it has completed its original purpose.    From waste to creativity This idea became personal to me during the COVID-19 pandemic.    During the lockdown, it was difficult to purchase art materials, including paper, from stationery shops. Instead of stopping my practice, I began looking around me for materials that were already available.    I started painting on discarded milk cartons and sweet boxes.    Something that was originally considered waste became my canvas.    What began as a practical solution gradually became a creative process that I genuinely enjoyed. It made me look at everyday objects differently. A box was no longer simply a box. It could become a surface, a material and eventually a piece of art.    This experience made me realise that sustainability does not always require expensive technology or complicated solutions. Sometimes, it begins with looking at an ordinary object differently.    Learning sustainability through art  Education can play a major role in developing this way of thinking.    In schools, children often make crafts and objects as part of their work education. These activities may seem simple, but they teach children something important: objects can be transformed.    A torn piece of cloth can become a doormat or a bag. Old newspapers can become envelopes or decorative objects. Plastic bottles can become flower pots or vases. Waste cardboard can become models and sculptures.    Children can also learn about natural materials through traditional art practices.    In Bengal and other parts of India, traditional practices such as alpana, wall painting and various forms of folk art connect creativity with local materials, culture and surroundings. Pattachitra artists, for example, traditionally work with natural and locally available materials, including handmade surfaces and natural pigments.    These practices remind us that sustainable thinking is not necessarily a new invention. Many traditional communities have historically worked with local materials because they had limited resources and understood the value of not wasting them.    Modern design can learn from this knowledge.    Designing less: Dematerialisation  One important idea in sustainable design is dematerialisation.    The word may sound complicated, but the idea is quite simple: use less material to provide the same function.    For example, if a product can be made lighter without becoming weaker, less material may be required to manufacture it.    Think about packaging. Does a product really need three layers of packaging? Does a large box need to be used for a small object? Can the packaging itself be reused?    These are design questions.    A sustainable designer does not simply ask, "How can I make this product beautiful?"    They also ask:    How much material do I need?    Where does this material come from?    How long will the product last?    Can it be repaired?    What will happen to it after it is discarded?    This is where design becomes more responsible.    Designing for a circular economy  Another important concept is the circular economy    The traditional model is often:    Take → Make → Use → Throw Away    The circular economy tries to change this into:    Make → Use → Repair → Reuse → Remanufacture → Recycle.    For example, imagine a chair.    In a traditional system, a broken chair might simply be thrown away and replaced with a new one. In a circular system, the chair could be designed so that individual parts can be repaired or replaced. The wood or metal could potentially be reused when the chair is no longer needed.    The goal is to keep materials in use for as long as possible.    This is why durability, repair and reuse are important parts of sustainable design.    If a product lasts ten years instead of one year, fewer products need to be manufactured and discarded. If a product can be repaired instead of thrown away, its useful life increases.    Sometimes, the most sustainable product is simply the one that we do not need to replace.    Choosing better materials  Material selection is another important part of sustainability.    Designers can look for materials that are less harmful to the environment and consider their entire life cycle — from where the material comes from to how it is manufactured, transported, used and finally disposed of.   This applies to fashion as well.    The textile industry produces enormous amounts of waste. Designers and consumers can therefore explore natural fibres, recycled materials, longer-lasting garments and better ways of repairing and reusing clothes.    Traditional textile and craft practices can also provide inspiration. Many Indian craft traditions have developed around local materials, local skills and techniques passed down through generations.    Instead of always searching for something new, perhaps we should also learn to value what already exists.    Architecture and sustainability  Sustainable thinking does not stop at products and artworks. It is also changing architecture.    Today, architects are increasingly thinking about sustainability before designing a building. Instead of depending entirely on air conditioning, buildings can be designed to make better use of natural ventilation and shading. Local materials can be considered to reduce transportation requirements. Natural light can reduce the need for artificial lighting during the day.    The basic question is simple:    How can a building provide comfort while consuming fewer resources?  A sustainable house does not necessarily have to look unusual or futuristic. Sometimes it can simply use traditional knowledge more intelligently.    In hot climates, for example, architectural features such as courtyards, shaded windows, thick walls and natural ventilation have historically helped buildings remain comfortable without depending entirely on mechanical cooling.    Modern technology can work together with such traditional knowledge rather than replacing it completely.    Sustainability is everyone's responsibility  Artists and designers can create new possibilities, but they cannot solve the environmental crisis alone.    Businesses need to rethink production. Governments need to create better waste-management systems. Schools need to educate children. Communities need to support responsible practices. And ordinary people need to change their everyday habits.    A person carrying a reusable bag may seem insignificant. A designer reducing the amount of material in a product may seem insignificant. A student turning waste cardboard into an artwork may seem insignificant.    But sustainability is made up of these small decisions.    When millions of people make better choices, the impact becomes much larger.    Creating a different future  Art has always reflected the world around us. It has recorded our beliefs, our struggles, our cultures and our dreams. Today, environmental concerns are becoming an important part of that story.    Perhaps the role of the artist and designer today is not only to create something beautiful, useful or interesting. It is also to ask whether what we create is necessary, responsible and respectful of the world around us.    My own experience of painting on discarded cartons taught me something very simple: sometimes, sustainability begins when we stop seeing something as waste.   A discarded box can become a canvas.    An old piece of cloth can become a bag.    A plastic bottle can become a planter.    Scrap can become a sculpture.    A damaged product can become something repairable.    And an ordinary idea can become a movement when many people begin to believe in it.    We do not necessarily need to stop creating.    We need to learn how to create better.    The future of sustainable design may not be about choosing between creativity and the environment. It may be about understanding that the two can exist together.    Because when art learns from nature, and design learns to respect resources, creativity does not become smaller.    It becomes more meaningful.    ABOUT AUTHOR Ankan Bandyopadhyay (born 1986, in Kolkata, West Bengal) is an Indian painter. He obtained a BFA and MFA  in Painting from Rabindra Bharati University, Kolkata. His paintings intricately depict the evolving perspectives of individuals and society, reflecting changes in both psychology and societal dynamics over time.His works have been displayed at the CIMA Gallery (Kolkata), Emami Art (Kolkata),19th Asian Art Biennale (Bangladesh) , 62nd National Exhibition Lalit Kala Akademi (New Delhi) and many more.Presently he is a professor of Ecole Intuit Lab,  Techno India University he lives and works at his studio in Kolkata. ...Read more